|
|
|
average |
 The average window is a way of collecting and displaying accumulated spectral
traces. Averaging over time reduces the random noise element which can
bring out the detail of steady state stationary signals. To open the
average window select the average option in the
displays sub section of the main
window.
The average window is a way of collecting and displaying accumulated spectral
traces. Averaging over time reduces the random noise element which can
bring out the detail of steady state stationary signals. To open the
average window select the average option in the
displays sub section of the main
window.
Click the thumbnail below for a larger image.
The popup menu on the right is accessed by holding down the third mouse button
while the mouse cursor is in the average window. Through this menu the
modes of collection, clearing, and display can be controlled.
Collect
There are two ways to collect average spectrum traces. The first is in
the record mode. You manually choose Start or hit the space key to begin,
data is collected for a period of time, then you choose Stop or hit the space
key. The second way is in the pause mode. Like in the histogram
window, a block of data is selected in the spectrogram or waveform window, if
no data is selected then the entire data buffer is used, next the Paste menu
button or the second mouse button is pressed while in the average
window. A wait cursor will popup while the average spectrum is
calculated. Note that the average window can collect data when it is
either open or iconified; when it is closed, spectrum collection is turned off.
decay
The average spectrum can be set to exponentially decay with a user specified
duration while in the record mode. This option changes the default
infinite spectral accumulation behavior to a more responsive real-time mode of
operation. Note that this decay option does not function in the pause
mode where the standard paste and accumulate functionality still operates.
 timer
timer
Select a timer function that acts every duration time slice while in the record
mode. The off option does nothing. The stop option
will halt average collection after the timer duration limit has expired.
The clear option will periodically clear the spectral trace. The
shift bank option will increment the average destination bank every
duration time slice and halt collection when the last bank is
complete. The rotate bank option is identical the
shift bank option but instead of halting collection the last bank
rotates to the first bank (F1) for an infinite bank rotation. The
last bank menu selects the final F#(1 - 12) bank that is used by both
the shift bank and the rotate bank settings.
For example; selecting the rotate bank option with a last bank of
F2 will ping pong between the average F1 and F2 banks forever with a switch
time controlled by the duration menu. Note that the timer function
can operate in conjunction with the decay option for combined
functionality.
duration
Select a decay or timer duration value between 25 ms and 24
hours. The decay, timer, or auto save options need to be selected for
the duration menu to be active.
open file
This is used to import spectral data. Load a single file or a set of
files (.1 - .12 suffixes) from disk to the average memory banks. The
file format is the same as is used in the
equalization window. The
format is two column (Hz, dB) ASCII text which can be plotted with xgraph or
gnuplot.
save file as ...
This is used to export spectral data to a two column (Hz, dB) ASCII text
file. Save any or all (.1 - .12 suffixes) of the average memory banks to
disk. Saved average data files can be opened with the above
open file command.
auto save
The average auto save feature generates time stamped text files at a rate
controlled by the timer duration setting. Durations of less than 10
seconds are not allowed. Use this option with caution to avoid filling
the storage device. The current channel selection is automatically
saved to a UTC time stamped file name with the same text data format that is
used by the save file as ... option. Using this option with the
decay or the clear timer option may be a useful combination.
Clear
Perform a clear operation on either
the current trace as defined by the destination menu or on All
twelve of the average memory traces. The auto clear option
controls if the current trace is cleared before new data is added to it such
as when a paste action, a start action, or a destination bank change while
collecting is performed. When auto clear is turned off the started
or pasted selection will just add to the average spectrum that is currently
there.
channel
The average window is monophonic
in that it only operates on a single channel at a time. To average
the spectrum of some other channel, first make sure it is ON in the input
channel mapping
window, and then select the appropriate channel position in this
menu.
 destination
This is the memory trace to use for the next average spectrum
collection. Like all of the menus in baudline this menu can be torn off
for quick access and to be a visual legend. Or the function keys
(F1 - F12) can be used to change trace destinations. If auto clear
is on then a memory trace is cleared each time it is selected.
display
This is used to display or hide a specific trace (F1 -F12). This menu is
similar in appearance to the destination menu. The short cut
key is Alt+F# and it acts as a toggle on/off.
Hz scaling
This is used to zoom the Hz axis in or out with a zoom factor from 1X to
64X. The minimum zoom factor is 1X which gives the most detail; it also
happens to be the default value. Zooming out gives a birds eye view,
and after a certain point the window width shrinks. This type of zooming
on the Hz axis is also know as reduction scaling. See the spectrogram
and spectrum window's description of the Hz scaling
reduction menu. Note that the
min max pair option is not available with the Average window.
dB scaling
This is used to zoom the dB axis in or out with a zoom factor from 1X to
128X. Alt+Up zooms in and Alt+Down zooms out.
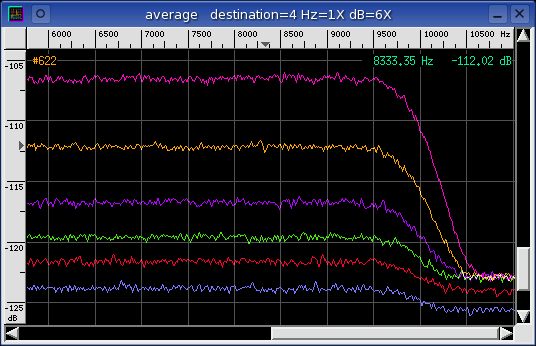
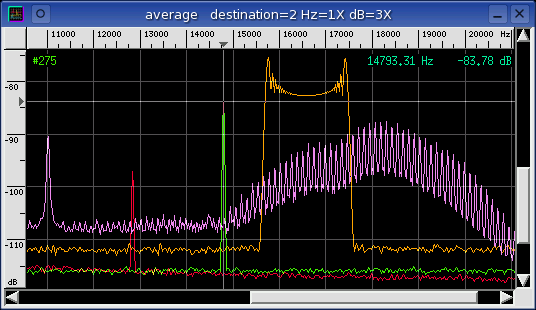
title bar
The destination trace bank number and the dB scaling factor are shown.
ruler
Like the ruler in the spectrum window the horizontal
axis on the top ruler is frequency. The vertical axis on the left ruler
is spectral energy in decibels (dB). At the top is the 0 dB reference
point which is defined to be the loudest level possible from the input source
(16 bits). At the bottom of the ruler is -136 dB which means 136 dB
beneath the 0 dB reference signal. Because this axis is zoomable the
ruler will change to reflect the current upper and lower limits.
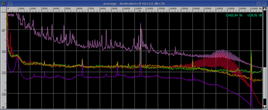
average
This is the summed and averaged frequency spectrums with different trace banks
being different colors.
OSD
The on screen display (OSD) in
the upper right corner of the spectrum window displays the frequency or
dB value that the mouse is currently pointing at. This is useful for
pinpointing measurements.
scroll bars
The frequency scroll bar is on the bottom and the dB energy
scroll bar is on the right. They allow moving the average view port
around. Note that the mouse scroll wheel is attached to the dB scroll
bar. The Alt+wheel and Alt+Shift+wheel zoom the dB and frequency axes
respectively. The arrow keys navigate and the Alt+arrow keys zoom as is
the expected behavior. The page up and page down keys navigate dB axis
up and down a full screen's worth at a time See the
keyboard reference tables
for all of the hotkey shortcuts.
harmonic helper bars
When the harmonic helper bars
are activated in the spectrum or spectrogram windows
they also pop up and track in the average window. This way the user
can check for harmonic relationships between the two windows at the same
time.
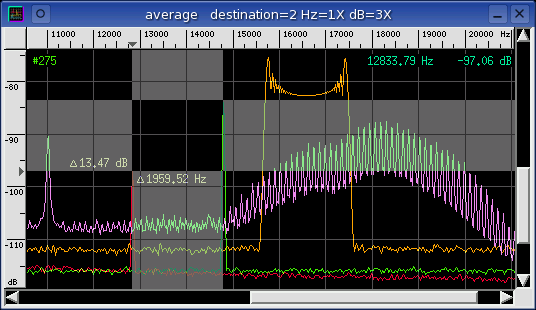
delta measurement bars
The average delta measurement bars use the same click, hold, shift, drag, and
release sequence that they do in the
spectrum window.
Here are the steps:
- Click and hold the 1st mouse button in the spectrum window
and the crosshairs will appear (see the illustration below).
- Move the mouse until the crosshairs are positioned to your measurement
starting location.
- Press the Shift key and drag the mouse. The delta measurement box
will appear and the delta text will display the frequency and dB difference
from the starting point to the end point. Accurate measurements can be
made this way.
- Release the 1st mouse button to make the measurement box and text
disappear.
The delta selected and the
frequency range display higher
precision delta measurement values for future reference. See the
illustration below for a graphical example of the click, hold, shift, drag,
and release operation.
click and hold

shift and drag
|
|
|
|
|
