|
|
|
Information |
SiS 7012
| vendor |
Silicon Integrated Systems
|
| product |
7012 |
| interface |
Intel ICH, chip on ECS 755-A2 motherboard |
| duplex |
full |
| channels |
2 |
| resolution |
16 bits |
| max rate |
48 Ksample/sec |
| chipset |
SI7012 |
| codec |
Realtek ALC655 rev 0
|
| operating system |
Fedora core3 Linux x86_64 2.6.12-1 |
driver |
intel8x0 ALSA 1.0.9rc2 |
buffer size |
input 64 KB, output 64 KB |
| test date |
Aug 30 2005 |
| notes |
Very strong DC offset at -35 dB.
Strange fragment drops every 600 seconds.
Set the Tone Generator's digital gain to -5 dB for 0.24 bits more of ENOB.
|
This card is part of the Full Duplex DAQ comparison
survey.
|
|
|
|
Sample Rate |
The sample rate on DAQ cards is not a fixed absolute constant. Like time,
it fluctuates, and it is difficult to measure accurately. Sometimes there
are relationships between the input and output sample rates that can reveal
interesting details about the inner working machinery.
The following table of measurements use a technique described in the
sample rate stability application
note. The rate column is the sample rate value that the collection
hardware is programmed to. The in/out rate and in/out error
columns are absolute measurements of the ADC / DAC clock. The
loop error column uses a tone generator loopback method for a high
accuracy measurement of the relative difference between the ADC and the DAC
clocks. The three error
PPM columns are theoretically
related by the formula: "in_error - out_error = loop_error"
| rate |
in rate |
out rate |
in error |
out error |
loop error |
|
| 4000 |
4010.977 |
4010.979 |
+2744.25 PPM |
+2744.75 PPM |
+110.6347 PPM |
* |
| 5510 |
5506.098 |
5506.099 |
-708.167 |
-707.985 PPM |
-42.7455 PPM |
* |
| 8000 |
8001.051 |
8001.056 |
+131.375 PPM |
+132.000 PPM |
+235.0659 PPM |
* |
| 11025 |
11012.20 |
11012.22 |
-1161.0 PPM |
-1159.2 PPM |
-42.2645 PPM |
* |
| 12000 |
12001.58 |
12001.59 |
+131.67 PPM |
+132.50 PPM |
+0.0000 PPM |
| 16000 |
16002.11 |
16002.15 |
+131.88 PPM |
+134.38 PPM |
-36.9851 PPM |
* |
| 22050 |
22024.38 |
22024.41 |
-1161.9 PPM |
-1160.5 PPM |
-19.3253 PPM |
* |
| 24000 |
24003.16 |
24003.18 |
+131.67 PPM |
+132.50 PPM |
+0.0000 PPM |
| 32000 |
32004.15 |
32004.23 |
+129.69 PPM |
+132.19 PPM |
+2.8044 PPM |
* |
| 44100 |
44048.83 |
44048.86 |
-1160.3 PPM |
-1159.6 PPM |
+1.7196 PPM |
* |
| 48000 |
48006.40 |
48006.42 |
+133.33 PPM |
+132.75 PPM |
+0.0000 PPM |
The "*" signifies a very noisy spectrum which probably makes the
loop error measurement invalid.
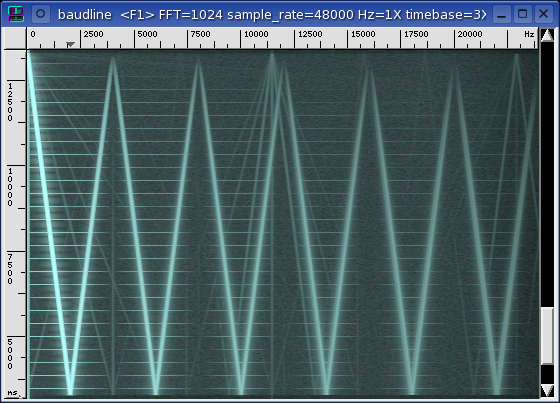
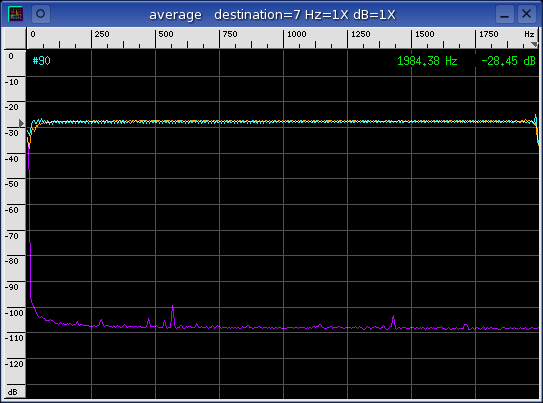
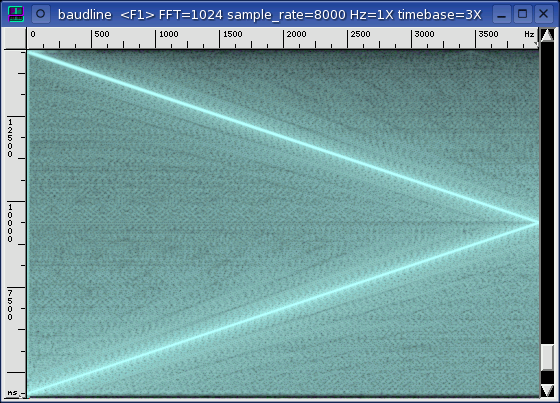
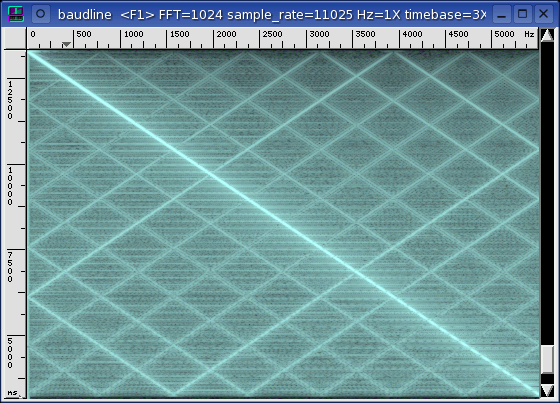
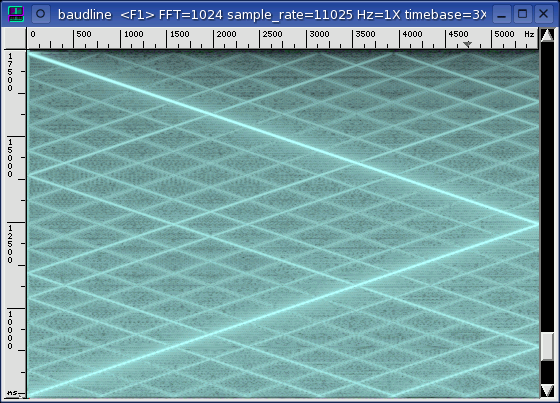
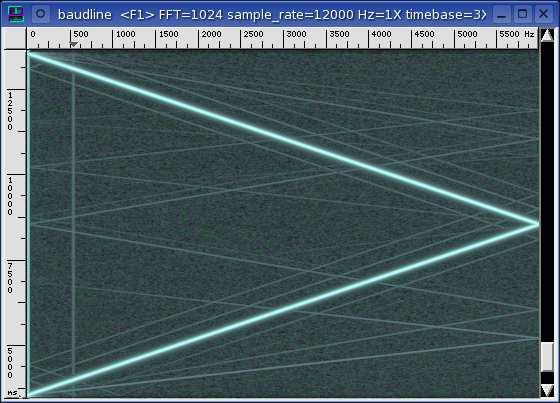
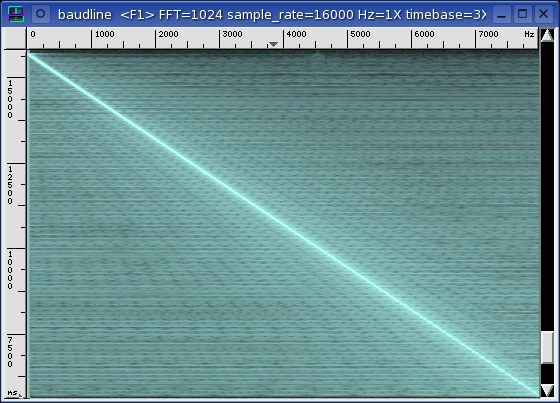
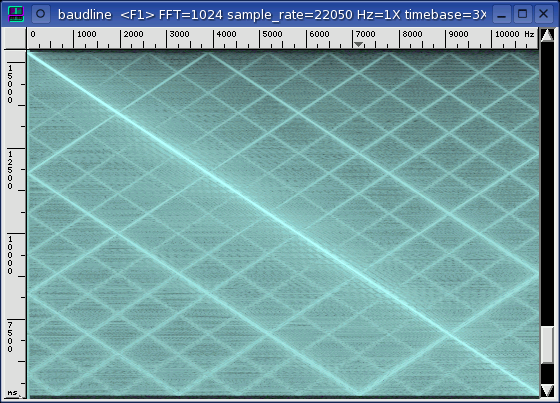
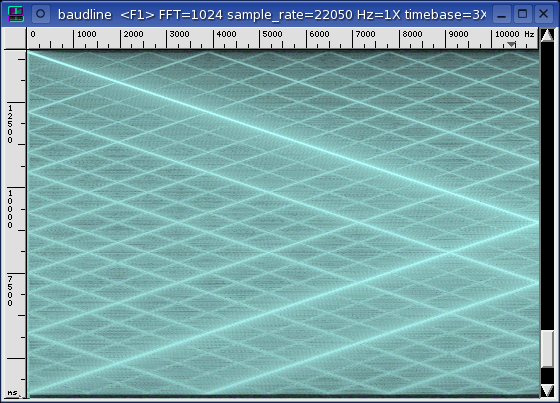
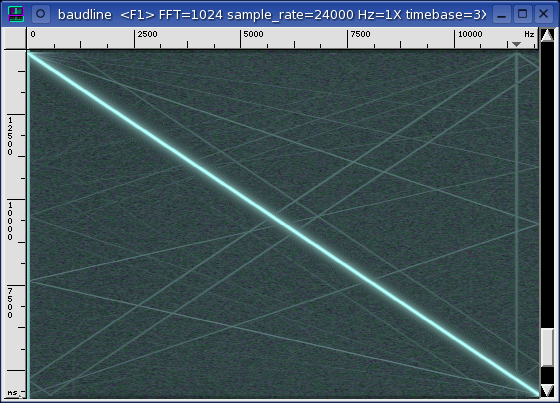
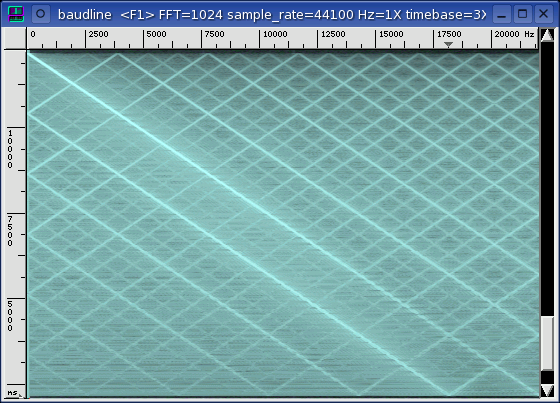
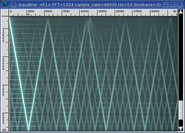
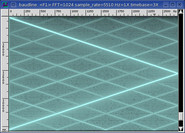
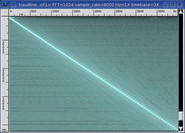
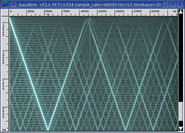
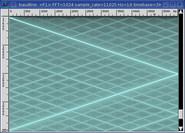
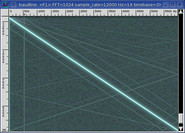
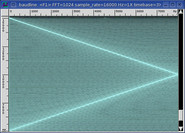
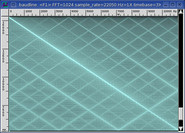
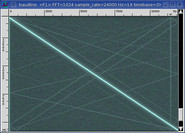
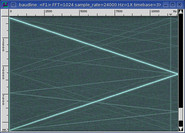
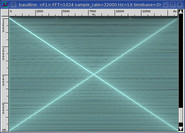
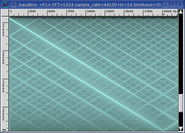
Below is the plot for the 22050 sample rate which shows a nice clean
convergence. All of the SiS 7012's sample rates display this respective
shape and behavior. This signifies the intel8x0 driver is handling the
fragment interrupts properly.
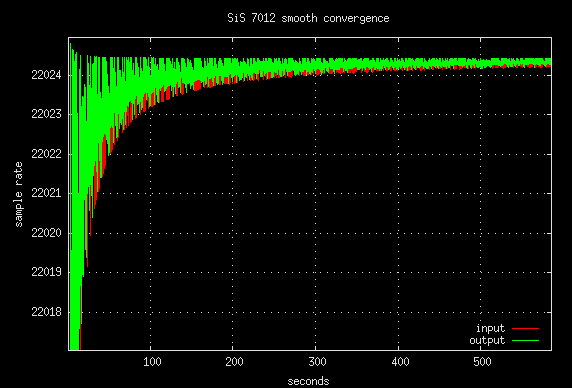
The precision with the in rate and out rate isn't as good as usual
because either Fedora core3 or the audio driver are causing a fragment drop
every 600 seconds.
|
|
|
|
Frequency Domain
|
The sound card's input and output jacks are connected with a short external
cable and run in full duplex mode. This is a loopback test and baudline's
tone generator is the signal source. Distortion, noise floor, filter
response, and inter channel crosstalk are the frequency domain measurements of
interest in this section.
The signal test sources are a pure sine wave, a linear sine sweep, and
WGN. The sine wave is
used for the distortions and crosstalk measurements. The linear sine
sweep and WGN are used for the filter characterization measurement.
Both are an application of the
swept sine vs. WGN technique
and are equivalent measures of the frequency response.
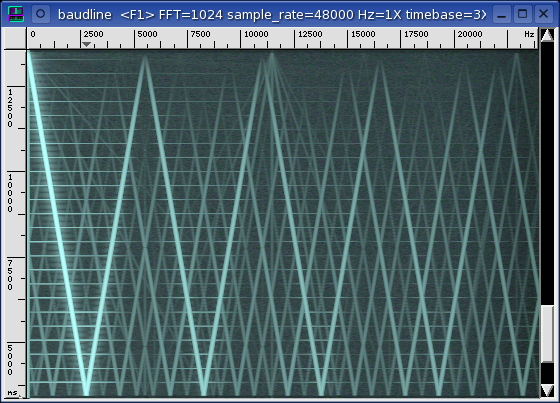
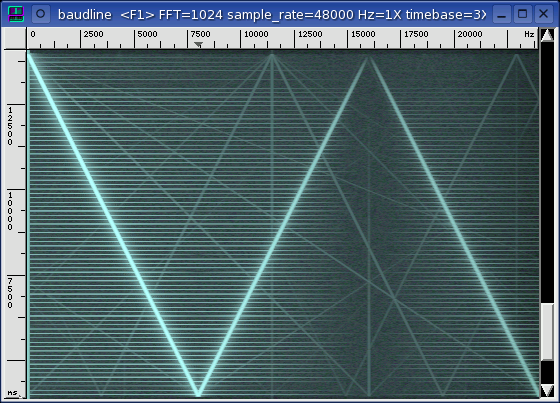
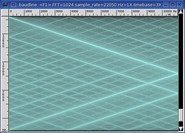
Since spectral performance is a function of sample rate, each of the sound
card's native rates will be tested. The highest sample rate is usually
the cleanest and this is advantageous because it allows the isolated testing
of the ADC and the
DAC. The matched,
source, and sink sample rate combinations are described below.
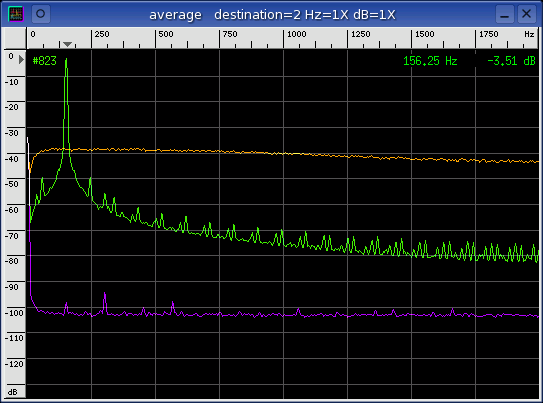
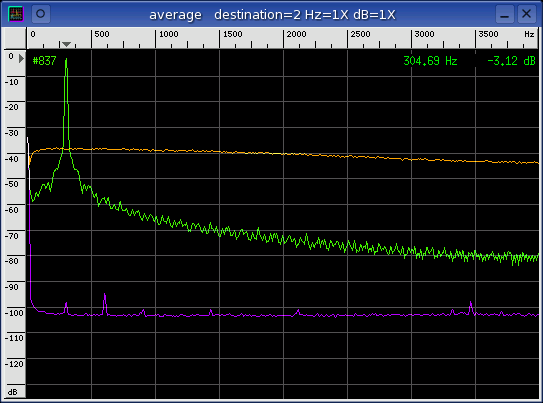
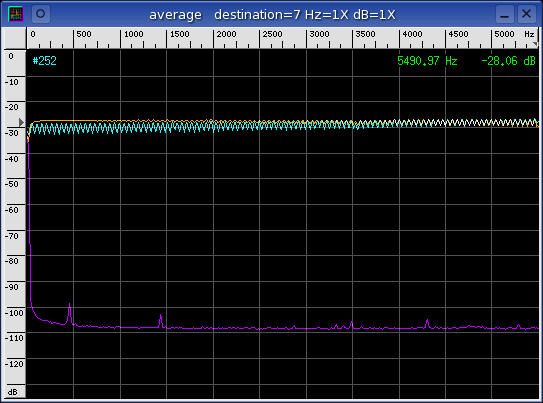
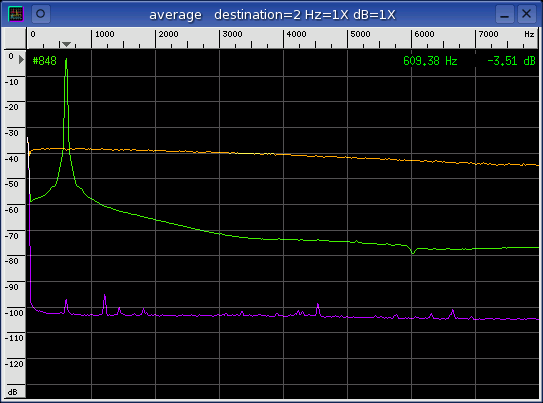
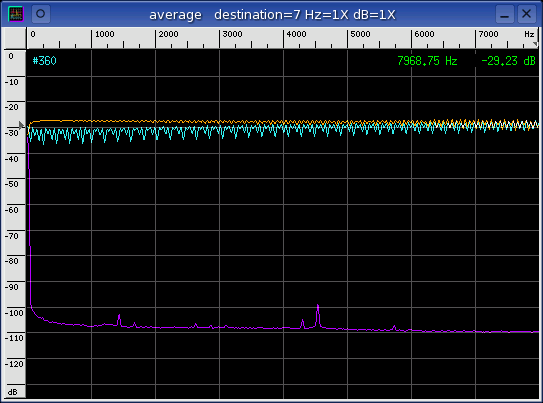
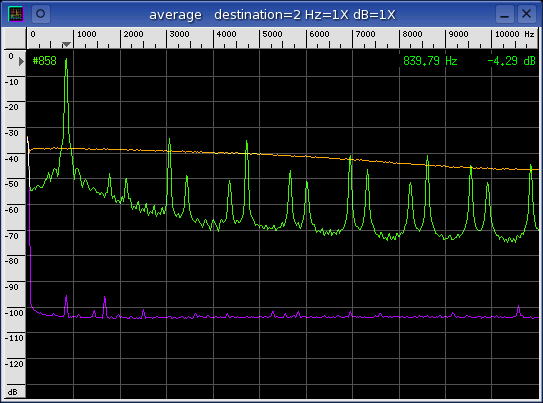
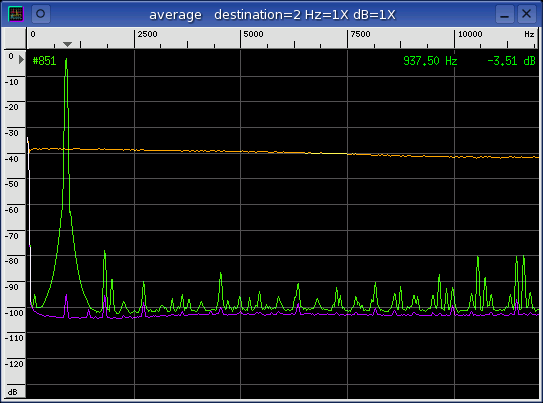
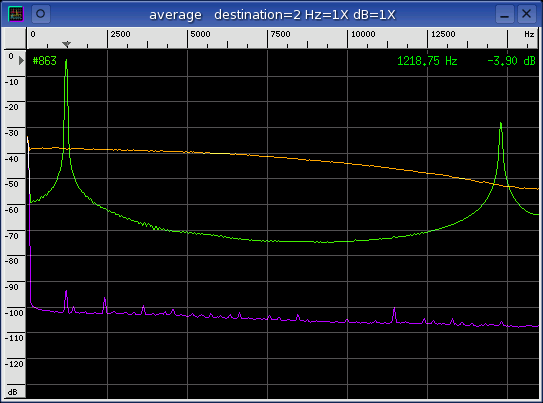
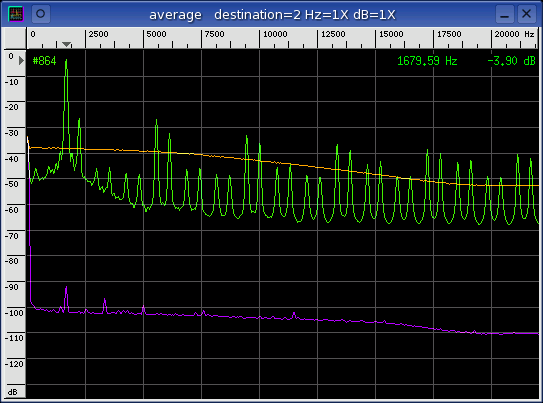
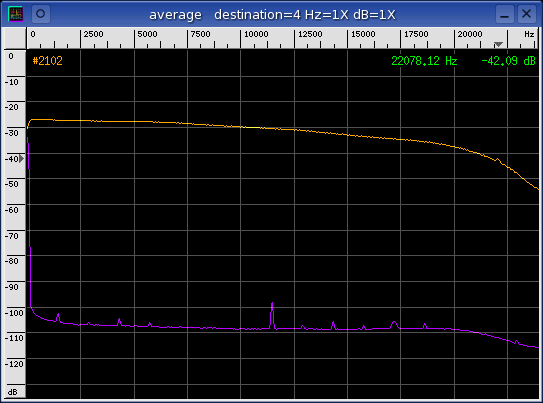
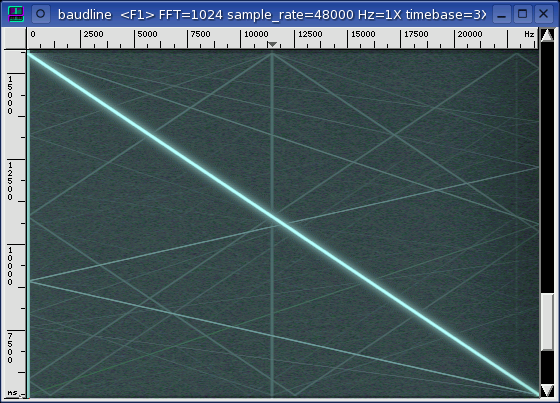
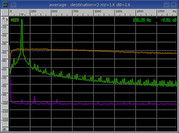
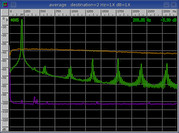
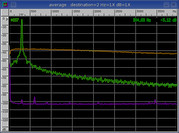
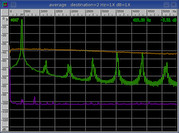
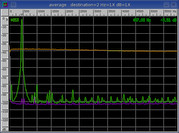
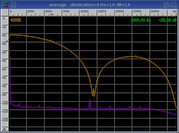
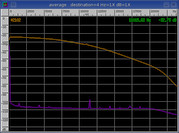
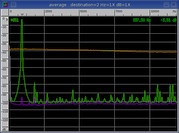
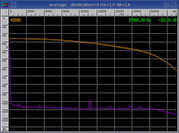
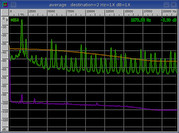
matched
The input and output sample rates are the same. This combination tests
the performance of both the ADC and the DAC in a matched mode of
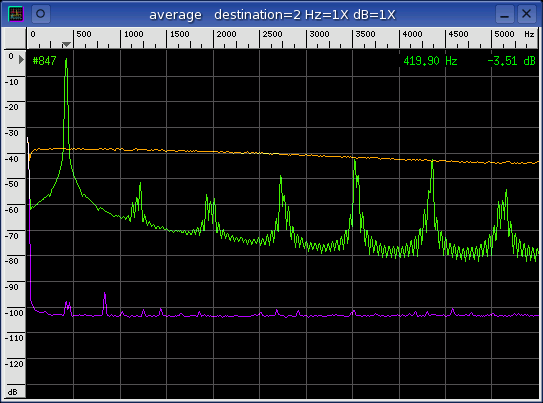
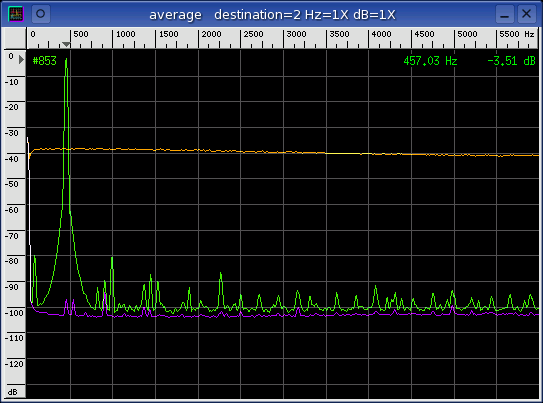
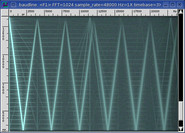
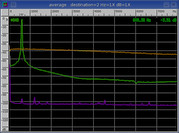
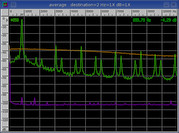
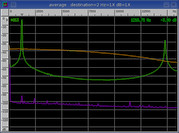
operation. The linear sine sweep signal in the left spectrogram display
and the WGN (orange) in the Average window characterize the in-band filter
response. The sine wave (green) in the Average window is used for
distortion and crosstalk measurements. The sine leakage (purple) is used
for crosstalk measurement
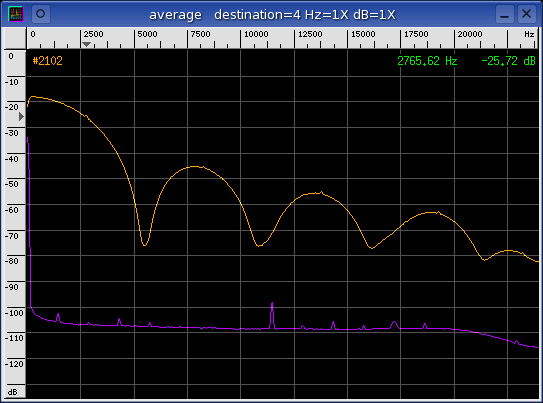
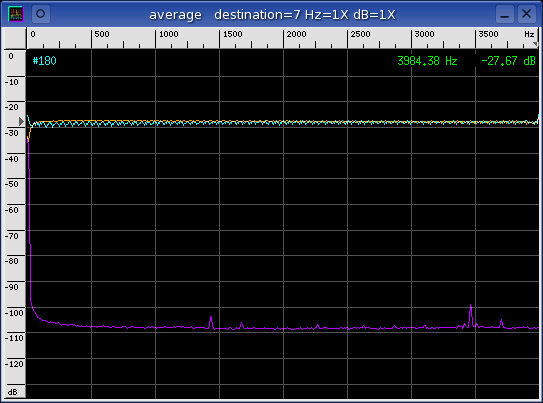
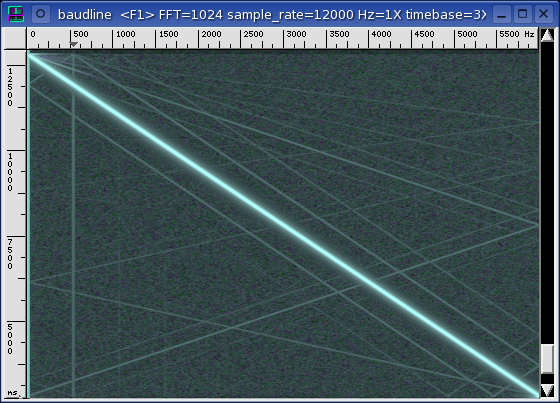
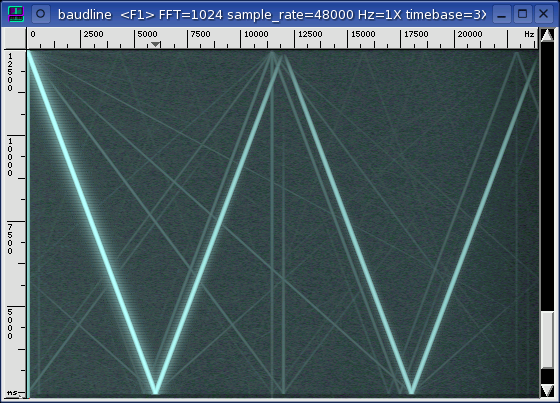
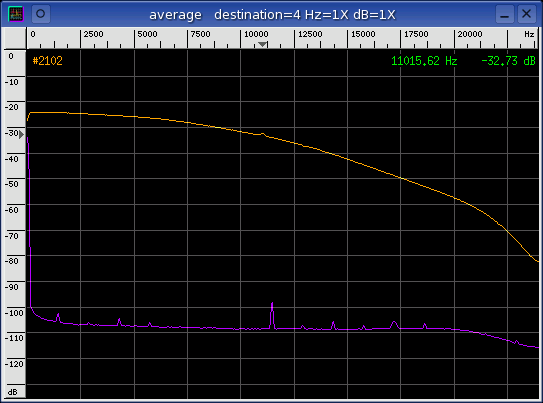
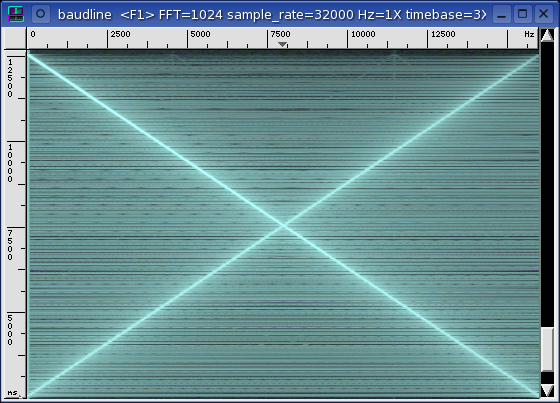
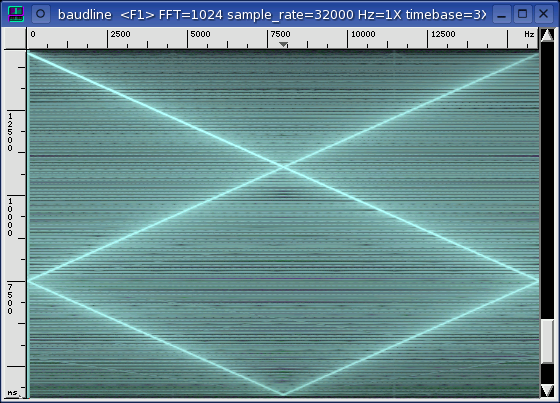
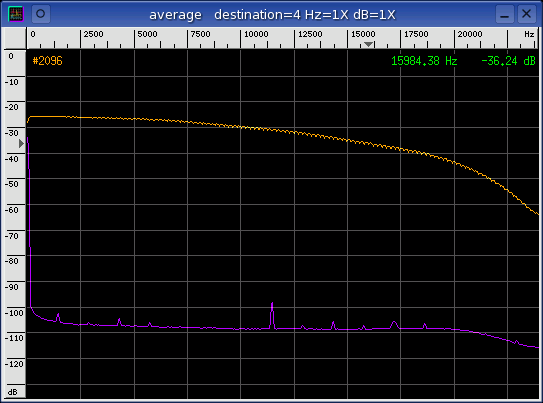
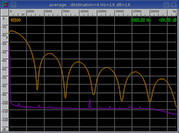
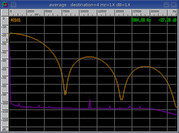
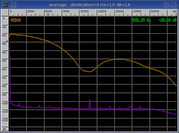
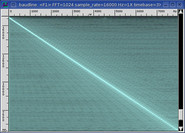
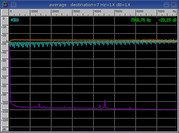
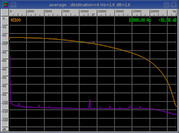
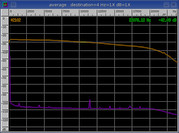
source
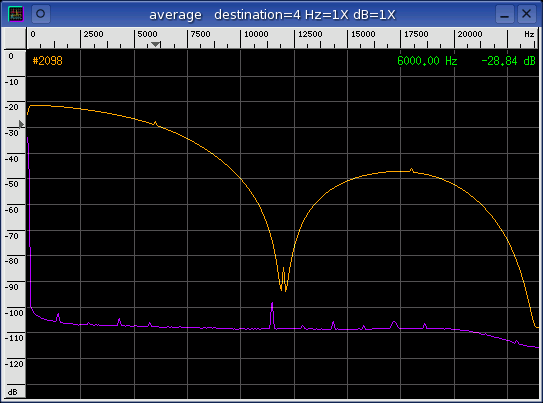
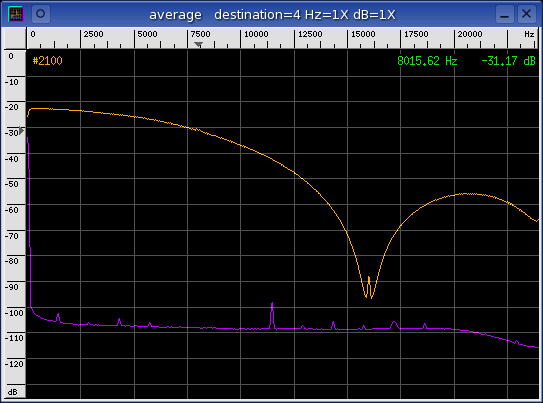
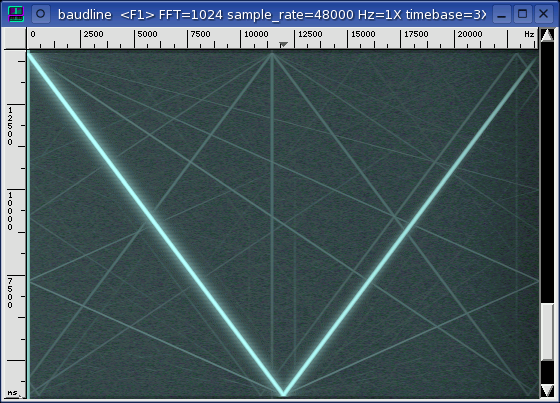
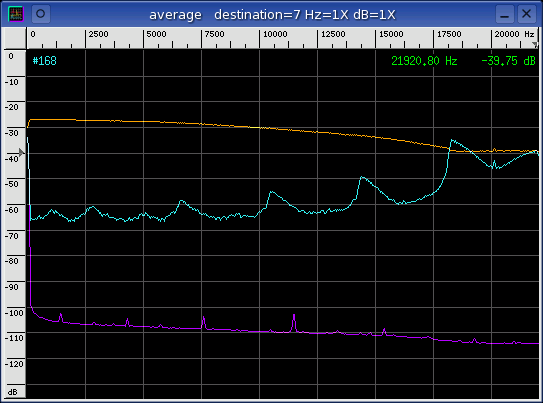
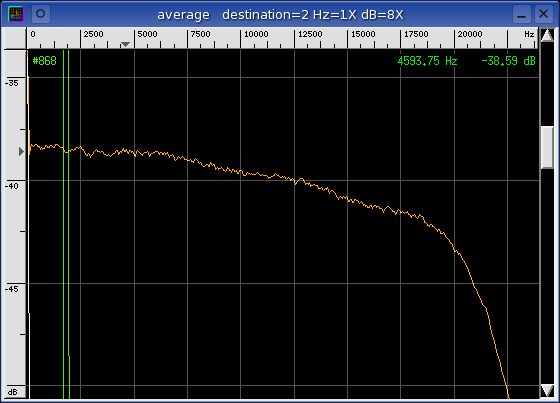
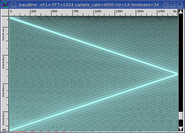
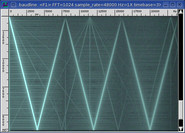
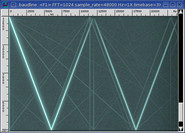
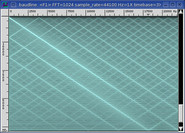
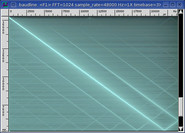
The sample rate of the input (sink) is the card's highest clean rate.
This combination tests the performance of the DAC. The linear sine sweep
signal in the middle spectrogram display characterizes the DAC filter
response. The position of the pass-band and the stop-band filter
transition is defined by the Nyquist frequency of the DAC. The noise
floor (purple) is the Average collection of a silent channel.
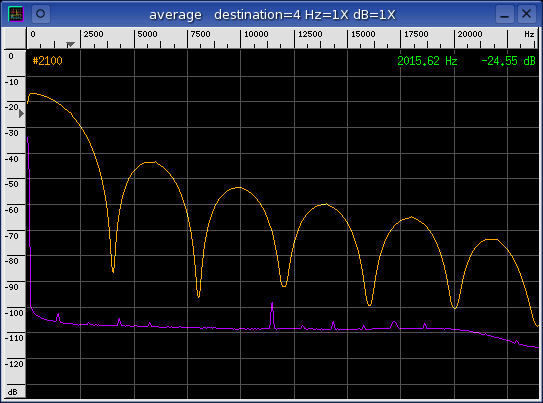
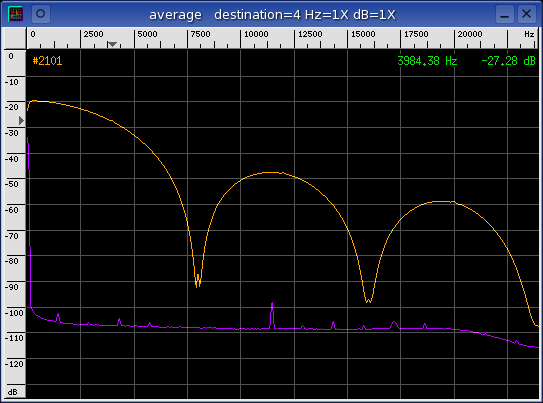
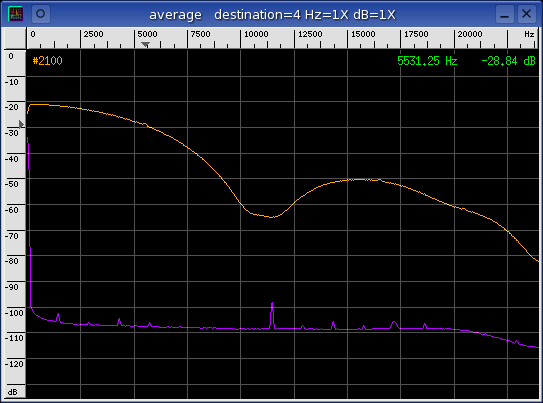
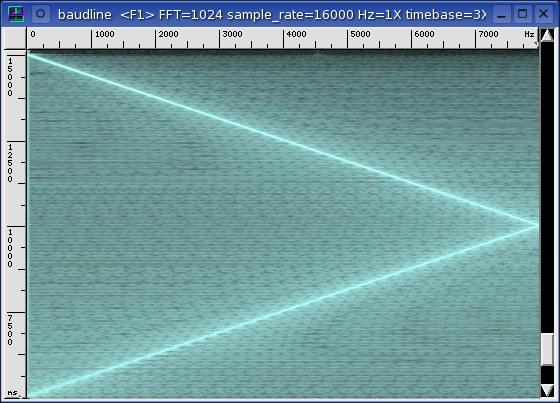
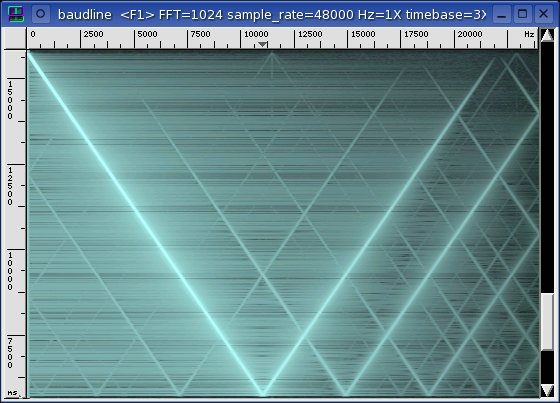
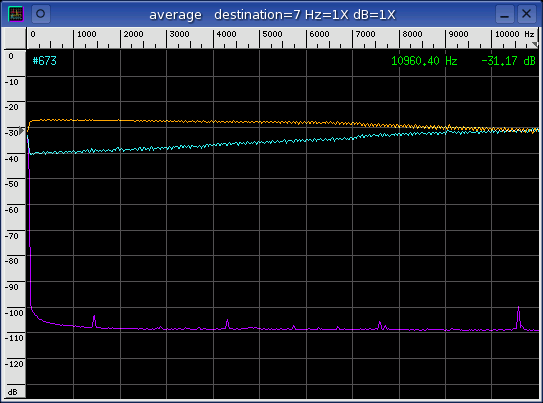
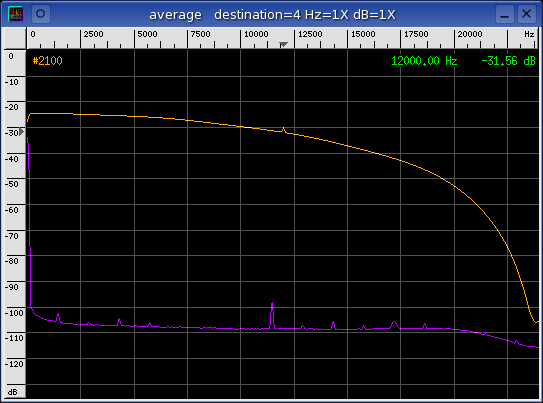
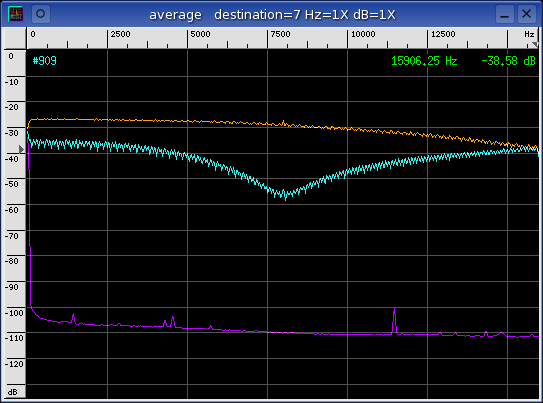
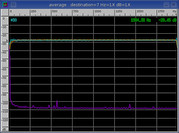
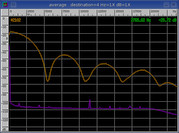
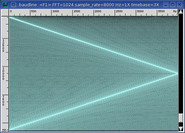
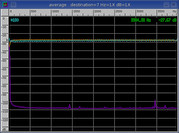
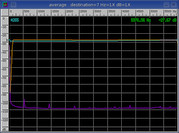
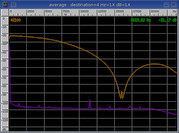
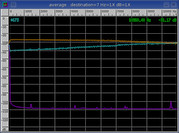
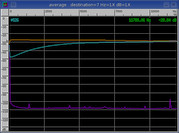
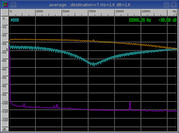
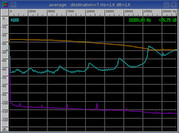
sink
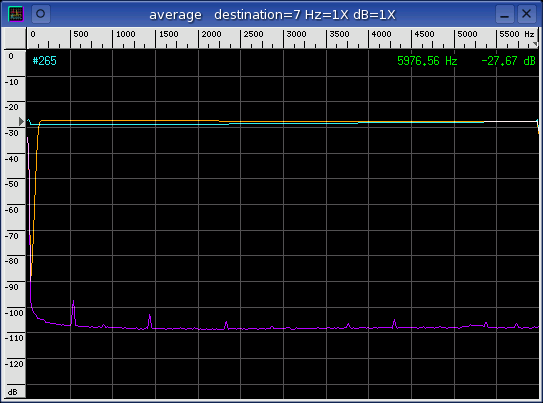
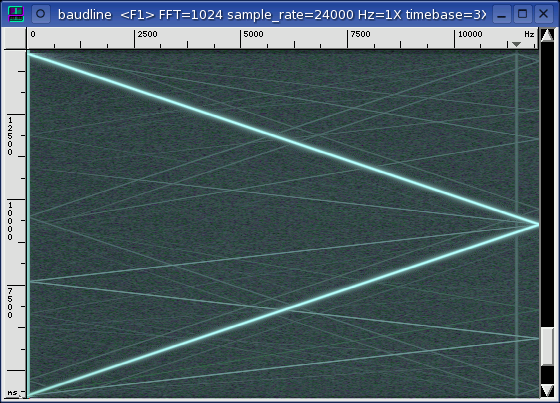
The sample rate of the output (source) is the card's highest clean rate.
This combination tests the performance of the ADC. The linear sine sweep
signal in the rightmost spectrogram display and the orange curve in the Average
window below it characterize the ADC filter response. The position of
both the pass-band and the stop-band filter transition is defined by time in
the spectrogram and by folded frequency in the Average window. The orange Average curve represents the pass-band while the cyan curve is a folded
representation of the stop-band ADC filter response. The noise floor
(purple) is the Average collection of a silent channel.
The naming convention for the columns below is (DAC -> ADC) where DAC
represents the source sample rate and ADC represents the sink sample
rate.
matched
|
source (DAC)
|
sink (ADC)
|
|
4000 -> 4000
|
4000 -> 48000
|
48000 -> 4000
|
|
|
|
|
|
|
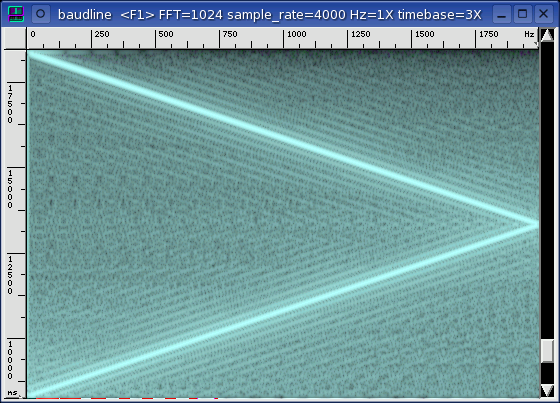
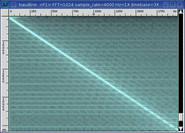
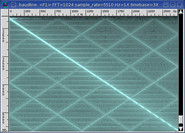
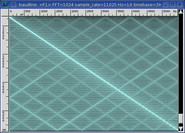
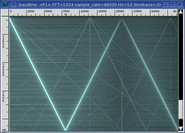
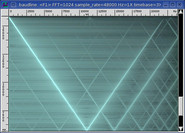
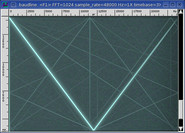
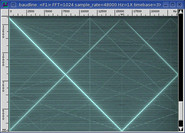
The wideband pulses in the 4000 source spectrogram sweep has a 0.382 second
period (1528 samples).
|
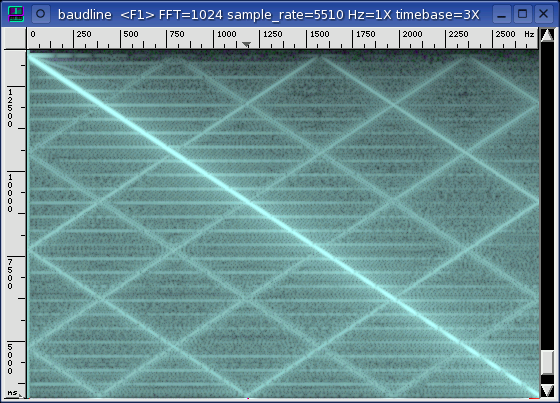
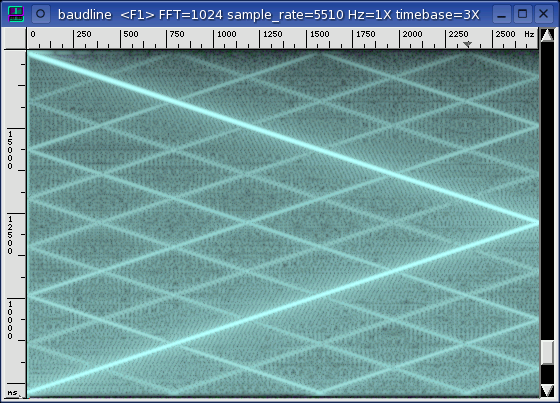
5510 -> 5510
|
5510 -> 48000
|
48000 -> 5510
|
|
|
|
|
|
|
The wideband pulses in the 5510 source spectrogram sweep has a 0.411 second
period (2265 samples).
|
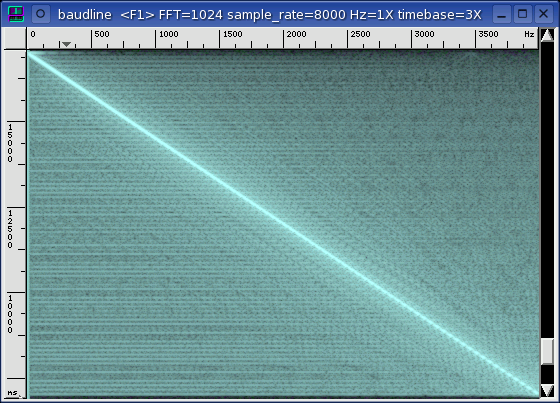
8000 -> 8000
|
8000 -> 48000
|
48000 -> 8000
|
|
|
|
|
|
|
The wideband pulses in the 8000 source spectrogram sweep has a 0.128 second
period (1024 samples).
|
11025 -> 11025
|
11025 -> 48000
|
48000 -> 11025
|
|
|
|
|
|
|
The wideband pulses in the 11025 source spectrogram sweep has a 0.206 second
period (2271 samples).
|
12000 -> 12000
|
12000 -> 48000
|
48000 -> 12000
|
|
|

|
|
|
|
|
16000 -> 16000
|
16000 -> 48000
|
48000 -> 16000
|
|
|
|
|
|
|
The wideband pulses in the 16000 source spectrogram sweep has a 0.128 second
period (2048 samples).
|
22050 -> 22050
|
22050 -> 48000
|
48000 -> 22050
|
|
|
|
|
|
|
|
24000 -> 24000
|
24000 -> 48000
|
48000 -> 24000
|
|
|
|
|
|
|
|
32000 -> 32000
|
32000 -> 48000
|
48000 -> 32000
|
|
|
|
|
|
|
The wideband pulses in the 32000 source spectrogram sweep has a 0.128 second
period (4096 samples).
|
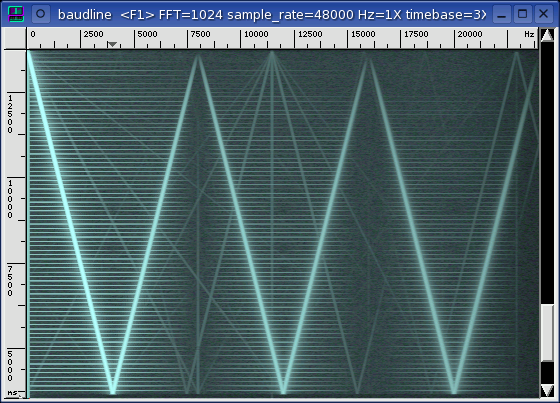
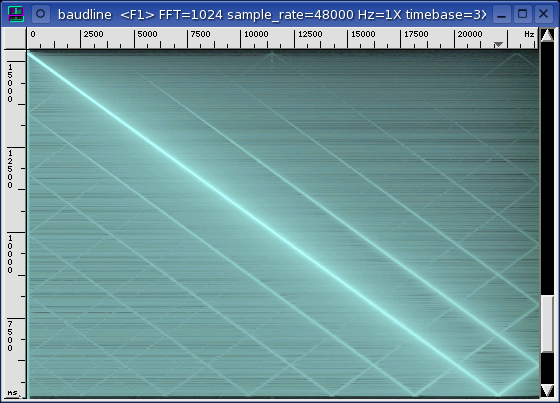
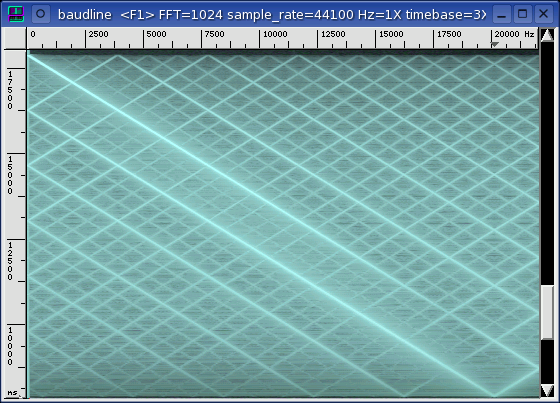
44100 -> 44100
|
44100 -> 48000
|
48000 -> 44100
|
|
|
|
|
|
|
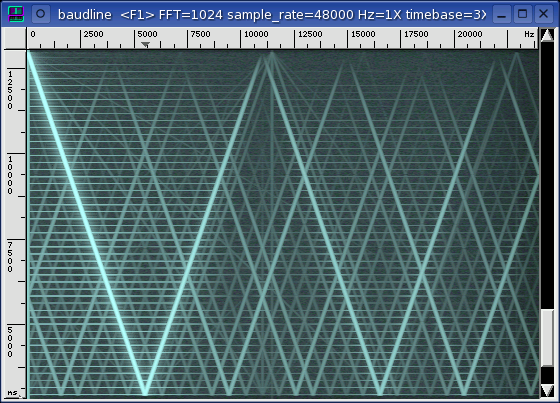
The orange WGN curve shows a very odd looking filter. Also notice the
intersecting lines in the spectrogram display.
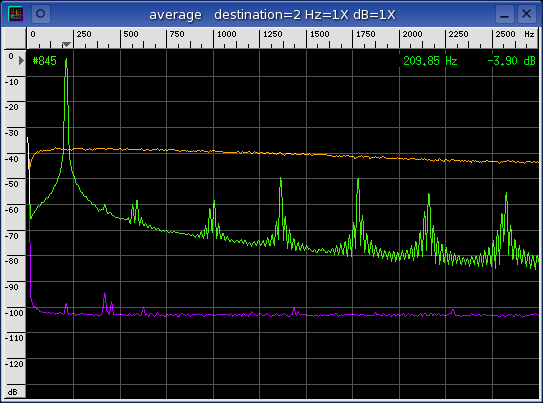
distortion
The following table of measurements were made using the technique described in
the sine distortion application
note. It is a full duplex test that uses a loopback of the tone generator
to measure the various distortion parameters. The stereo crosstalk
column is a measure of channel leakage that uses a sine wave channel and a
silent channel as the signal sources.
| rate |
SNR |
THD |
SINAD |
ENOB |
SFDR |
crosstalk |
|
| 4000 |
+39.79 dB |
-47.22 dB |
+39.07 dB |
+6.196 bits |
+45.19 dB |
-92.07 dB |
* |
| 5510 |
+40.28 dB |
-50.51 dB |
+39.89 dB |
+6.332 bits |
+46.24 dB |
-91.54 dB |
* |
| 8000 |
+37.46 dB |
-47.20 dB |
+37.02 dB |
+5.856 bits |
+41.28 dB |
-90.51 dB |
* |
| 11025 |
+30.96 dB |
-50.15 dB |
+33.85 dB |
+5.331 bits |
+38.28 dB |
-92.74 dB |
* |
| 12000 |
+70.81 dB |
-75.33 dB |
+69.50 dB |
+11.251 bits |
+76.78 dB |
-90.37 dB |
| 16000 |
+51.47 dB |
-54.32 dB |
+49.66 dB |
+7.955 bits |
+55.81 dB |
-90.39 dB |
* |
| 22050 |
+25.85 dB |
-39.91 dB |
+25.68 dB |
+3.973 bits |
+31.61 dB |
-90.72 dB |
* |
| 24000 |
+70.00 dB |
-71.93 dB |
+67.85 dB |
+10.977 bits |
+74.82 dB |
-89.03 dB |
| 32000 |
+23.62 dB |
-42.89 dB |
+23.57 dB |
+3.623 bits |
+23.62 dB |
-88.31 dB |
* |
| 44100 |
+18.46 dB |
-29.17 dB |
+18.11 dB |
+2.715 bits |
+22.80 dB |
-86.51 dB |
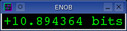
| 48000 |
+69.84 dB |
-70.95 dB |
+67.35 dB |
+10.894 bits |
+72.69 dB |
-86.33 dB |
The "*" symbol signifies the distortion metrics for that particular sample rate
are invalid due to spectral damage caused by wideband noise pulses.
All the rates except 12000, 24000, and 48000 suffer from some major spectral
flaws. The flaws are in the form of wideband pulse, crosshatch aliasing,
folded aliasing, or a combination of all three. The 12000, 24000, and
48000 have the best distortion values.
The filters on the playback DAC side are very poor with minimal
rejection. The filters on the record ADC side are practically
nonexistent.
The spectrogram sweeps and the average spectrum plots look surprisingly similar
to the VIA 8235 audio device which also
uses a Realtek codec.
|
|
|
|
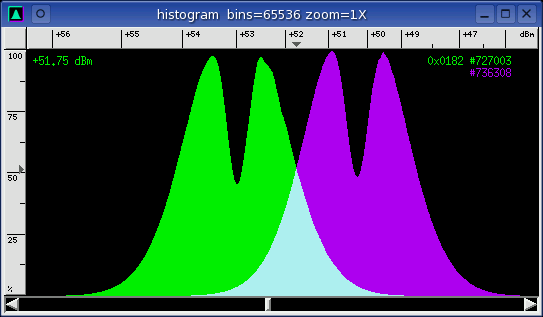
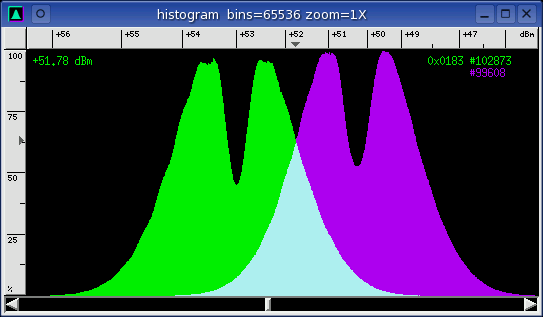
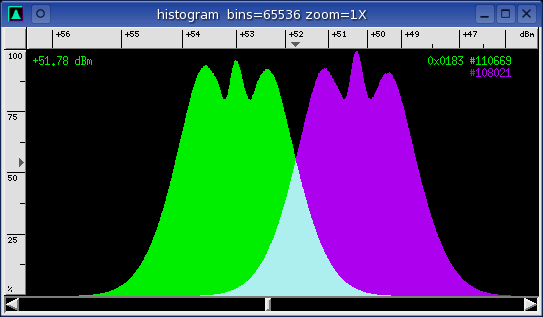
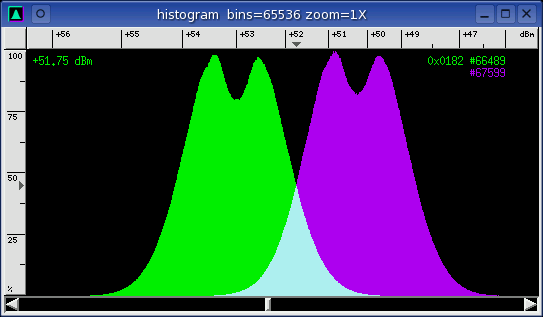
Quantization |
A white Gaussian noise signal source was generated and captured in full
duplex loopback fashion at each of the standard sample rates. The
Histogram plots below
show a unique sample distribution that is dependent on sample rate.
The purple and green Gaussian histogram shapes are slightly separated because
of a small inter channel difference of their DC offsets.
4000, 5510, 8000, 11025, 16000, 22050
A nice Gaussian shaped bell curve with a wide notch cut down the center line.
12000
Like the above histogram but with the top points smoothed down and some extra
lumps added.
24000
Like the previous histograms but the two horns are squeezed together slightly
and the addition of a third peak in the center where the cutout notch was.
32000
This looks exactly like the 24000 histogram but with the new center peak
removed.
44100

A slightly melted version of the 24000 histogram.
48000
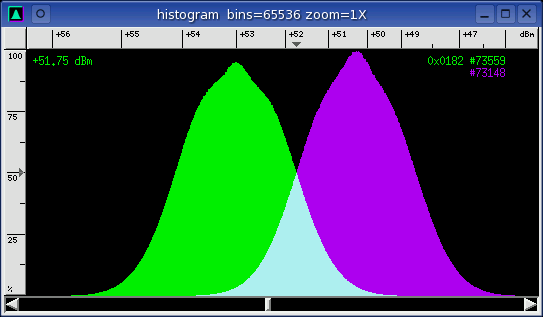
Looks more like a standard Gaussian curve but with a slight center peak.
The progression of the center line notch as the sample rate increases is
interesting. Not sure what this says about the resampling algorithm
but something unusual is at work.
|
|
|
|
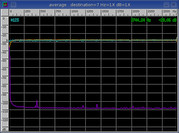
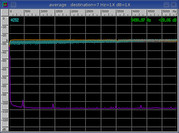
Channel Delay |
A sine wave signal was generated and captured in full duplex loopback
mode. The time domain response was observed with the
Waveform window where
the green curve represents the left channel and the purple curve represents
the right channel.
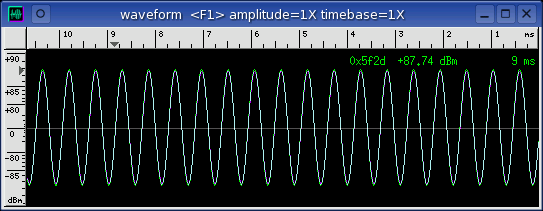
The SiS 7012 chipset has a zero sample inter channel delay.
|
|
|
|
Analysis |
The 12000, 24000, and 48000 rates have a zero PPM sample rate loop error,
clean spectrum / spectrogram sweeps, and low distortion. Unfortunately
the 12000 rate lacks an ADC filter and the 24000 rate has a very poor ADC
filter with only -20 dB of rejection.
The large sample rate PPM in/out errors seem to correlate well with the
crosshatch aliasing found on the sink ADC side for the 4000, 5510, 11025,
22050, and 44100 rates. Not sure what the DSP connection is but it
probably has to do with the flawed algorithm that is performing the sample rate
conversion.
No correlation between the unusual histogram quantization shapes and spectral
performance can be made.
|
|
|
|
Conclusion |
The filters on the playback DAC side are very poor with minimal
rejection. The filters on the record ADC side are practically
nonexistent.
Only use the 48000 sample rate with the SiS 7012 chipset. All of the
other sample rates suffer from severe spectral damage. Audio playback at
44100 is not recommended with this chip.
|
|
|
|
|