|
|
|
waveform |
 The waveform display is a sample amplitude vs. time view into
the data. This is similar to the traditional oscilloscope display.
When baudline is in the record or play modes the waveform displayed is
the real-time data that is currently being input or output. When
baudline is in the pause mode the waveform displayed here is linked to the
spectral slice cursor in the main spectrogram window.
The waveform display is a sample amplitude vs. time view into
the data. This is similar to the traditional oscilloscope display.
When baudline is in the record or play modes the waveform displayed is
the real-time data that is currently being input or output. When
baudline is in the pause mode the waveform displayed here is linked to the
spectral slice cursor in the main spectrogram window.
To open the waveform window select the waveform option in the
displays sub section of the main
window.
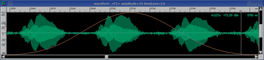
Click the thumbnail below for a larger image.
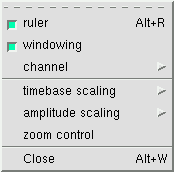
The popup menu on the right is accessed by holding down the third
mouse button while in the waveform window. Through this menu windowing
channel enabling, timebase scaling, amplitude scaling, and opening the
zoom control can be performed.
windowing
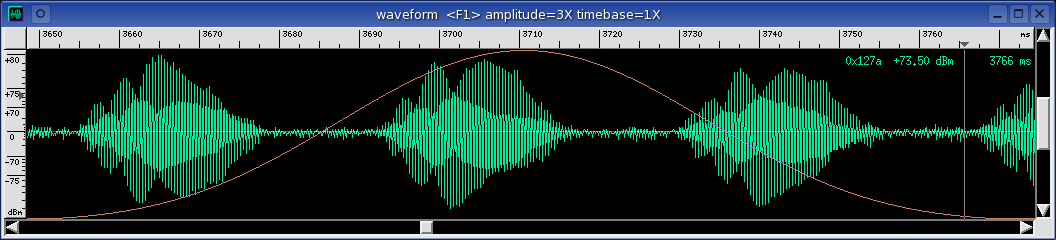
Enable or disable the windowing overlay. The orange hump shaped overlay
is the spectral windowing
region. It is overlaid on top of the samples that are currently
transformed into frequency space and displayed in the spectrum window.
This also happens to match the data of the slice cursor in the spectrogram
window. Think of this as a big wide cursor that shows exactly what is
being imported to the spectrum window.
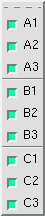 channel
This selects which channels should be enabled for viewing. The default
is to view all channels. Note the
channels need to be mapped
and they need to be enabled in this menu before anything is displayed.
The intended use of this menu is to reduce the number of displayed waveform
channels for aesthetic or duplicate reasons.
timebase scaling
With the menu shown above the horizontal timebase axis can be zoomed in or
out. You may find tearing off this menu or using the Alt+arrow shortcuts
faster and more convenient. See the
keyboard reference tables
for all of the hotkey shortcuts.
amplitude scaling
This is a zoom factor into the vertical axis of the waveform amplitude
axis. Zoom all the way in (Alt+Up) to 8192X to see small details or zoom
all the way out (Alt+Down) to 1X to see the full native amplitude range.
zoom control
Open the zoom control window.
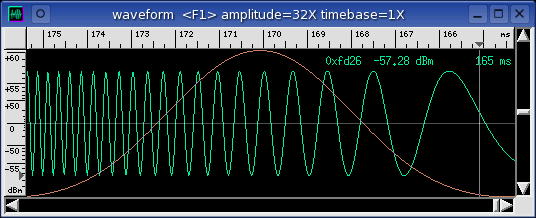
title bar
Like the spectro window's title
bar, this title bar contains a lot of useful state information about the
waveform window, such as F# key bank selected and status, amplitude and timebase
zoom factors, and file name if any.
ruler
The horizontal axis on the top ruler
is time in milliseconds (ms); note that depending on the zoom level the units
can switch to seconds (s). The vertical axis on the left ruler is in
dBm which ranges from +90 dBm, the maximum sample amplitude in 16 bit linear
coding space, to -90 dBm, the most negative sample amplitude. Note
that 0 dBm is the origin and it represents the smallest sample amplitude
which is the same as digital silence.
waveform
This is sample amplitude vs. time with either the newest recorded data or the
end of the file being the rightmost. Stereo or multiple channels will be
overlaid or they will be in separate rows depending on the position in
the input channel mapping
window. See the purple-green stereo example waveform below:
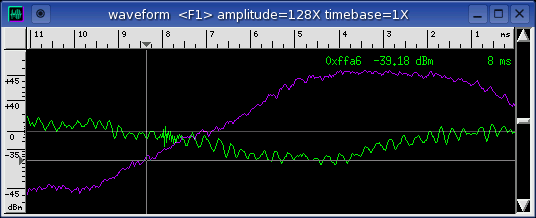
cursor bar
There are two different possible cursors in the waveform window.
In the pause mode a light gray vertical line tracks the selector bar in
the spectrogram window. The offset of this line is a function of the
windowing overlay shape. Its movement follows the mouse, and it
represents the true position within the waveform file. Press and hold the
second mouse button to pop up the crosshairs (see above picture). The
crosshairs are useful for making accurate time-amplitude measurements.
OSD
The on-screen display shows the time, dBm, and hexadecimal sample value that
the mouse is currently pointing to.
scroll bars
The time history scroll bar is on
the bottom and amplitude scroll bar is on the right. They allow
moving the viewport around in the waveform domain. Note that the mouse scroll
wheel is attached to the amplitude scroll bar, Alt+wheel zooms the vertical
amplitude axis, and the Shift+Alt+wheel switches control to zoom the horizontal
time axis. The arrow keys navigate and the Alt+arrow keys zoom
as would be expected. The home, end, page up and down, like with the
spectrogram window, navigate the time axis. See the
keyboard reference tables for all of
the hotkey shortcuts.
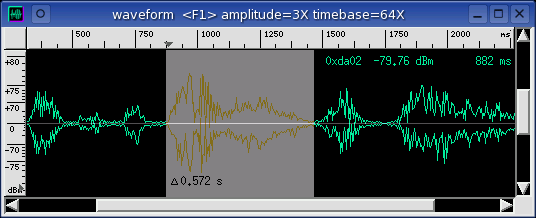
delta duration measurements
Click and drag the cursor bar to select a section of sample data. A delta
duration appears as a "heads up" display next to the mouse pointer. When
the mouse button is released the selection remains but the delta duration
disappears. The delta duration is simply the absolute value of the
difference of the start position from the end selection position. It can
be used as an accurate method to measure time intervals. The selected
data can then be saved or pasted into a number of other windows for processing
and analysis.
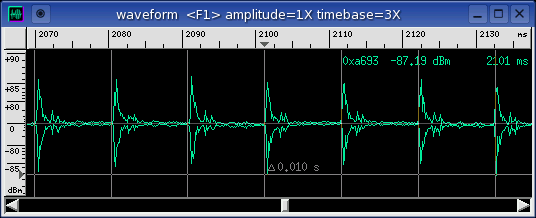
periodic helper bars
In the screenshot above, the vertical lines are the periodic helper bars.
They are useful for determining the exactness of any repeating or periodic
behavior. They can be used for making precise delta timing
measurements. They can also be used to create a sort of user adjustable
grid for the time domain. Here are the steps on how to use them:
- Press and hold the 2nd mouse button which will pop up the cursor
crosshairs.
- Move the mouse in the waveform display and align the time axis slice
cursor to a point of interest.
- Press and release the Shift key. This will flip the orientation of
the crosshairs bars transforming them into the periodicity helper bars.
This action will also anchor the initial position (0 ms).
- Move the mouse and the periodicity bars will appear and move
appropriately. The spacing of the entire grid changes. Rough
measurements can be made quickly.
- Hit the left or right arrow keys to perform fine tune adjusting of the
delta periodicity. Sub sample resolution can be achieved this way.
- Release the 2nd mouse button to make the lines disappear. Or press
the Shift key to toggle back to the crosshair behavior (goto step
1). Move the mouse, adjust the time anchor point, and hit Shift
again. ....
The periodicity bars are also automatically mirrored in the
Spectrogram window in a dual
tracking manner.
|
|
|
|
|