|
|
|
Information |
VIA 8235
| vendor |
Via Technologies
|
| product |
VT8235 |
| interface |
chip on ECS P4VXASD+ motherboard |
| duplex |
full |
| channels |
2 |
| resolution |
16 bits |
| max rate |
48 Ksample/sec |
| chipset |
VIA8233 rev 50 |
| codec |
Realtek ALC101
|
| operating system |
Red Hat 7.3 Linux x86 2.6.7 |
driver |
via82xx ALSA 1.0.4 |
buffer size |
input 64 KB, output 64 KB |
| test date |
Sep 7 2005 |
| notes |
Very strong DC offset of -35 dB on the right channel.
|
This card is part of the Full Duplex DAQ comparison
survey.
|
|
|
|
Sample Rate |
The sample rate on DAQ cards is not a fixed absolute constant. Like time,
it fluctuates, and it is difficult to measure accurately. Sometimes there
are relationships between the input and output sample rates that can reveal
interesting details about the inner working machinery.
The following table of measurements use a technique described in the
sample rate stability application
note. The rate column is the sample rate value that the collection
hardware is programmed to. The in/out rate and in/out error
columns are absolute measurements of the ADC / DAC clock. The
loop error column uses a tone generator loopback method for a high
accuracy measurement of the relative difference between the ADC and the DAC
clocks. The three error
PPM columns are theoretically
related by the formula: "in_error - out_error = loop_error"
| rate |
in rate |
out rate |
in error |
out error |
loop error |
|
| 4000 |
4010.3834 |
4010.3880 |
+2595.85 PPM |
+2597.00 PPM |
+144.295 PPM |
* |
| 5510 |
5505.3010 |
5505.3037 |
-852.813 PPM |
-852.323 PPM |
-170.005 PPM |
* |
| 8000 |
7999.8866 |
7999.8932 |
-14.1750 PPM |
-13.3500 PPM |
+247.488 PPM |
* |
| 11025 |
11010.5997 |
11010.6039 |
-1306.15 PPM |
-1305.77 PPM |
-35.3544 PPM |
* |
| 12000 |
11999.7891 |
11999.8130 |
-17.5750 PPM |
-15.5833 PPM |
+0.0000 PPM |
| 16000 |
15999.7376 |
15999.7508 |
-16.4000 PPM |
-15.5750 PPM |
-50.9133 PPM |
* |
| 22050 |
22021.1385 |
22021.1482 |
-1308.91 PPM |
-1308.47 PPM |
-22.5884 PPM |
* |
| 24000 |
23999.6052 |
23999.6165 |
-16.4500 PPM |
-15.9792 PPM |
+0.0000 PPM |
| 32000 |
31999.4797 |
31999.4876 |
-16.2594 PPM |
-16.0125 PPM |
+2.5234 PPM |
* |
| 44100 |
44042.3070 |
44042.3116 |
-1308.23 PPM |
-1308.13 PPM |
+2.3241 PPM |
* |
| 48000 |
47999.1302 |
47999.2451 |
-18.1208 PPM |
-15.7271 PPM |
+0.0000 PPM |
The "*" symbol signifies severe spectral damage such that the loop error
measurements might be off by an order of magnitude.
The 12000, 24000, and 48000 sample rates all have a zero PPM loop error
measurement and an absolute rate offset of about -16 PPM. This means that
the ADC and DAC clocks are in lockstep at those particular sample rates.
These are also the only rates that didn't suffer from severe spectral damage.
The 11025, 22050, and 44100 sample rates have in/out errors of about
-1308 PPM. The 5510 rate is roughly two thirds that at -852 PPM.
The 4000 rate, which is not related at all, has an error of almost three times
-1308 with a +2600 PPM error. Not sure how the error ratios for the 4000
and 5510 rates are connected but a common algorithmic flaw is at work.
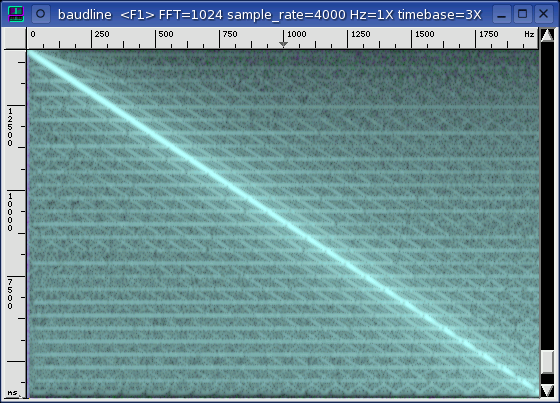
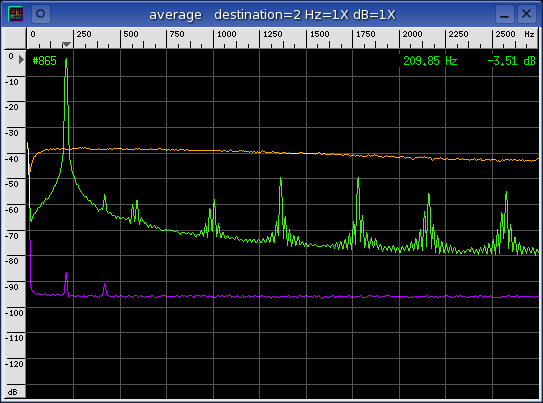
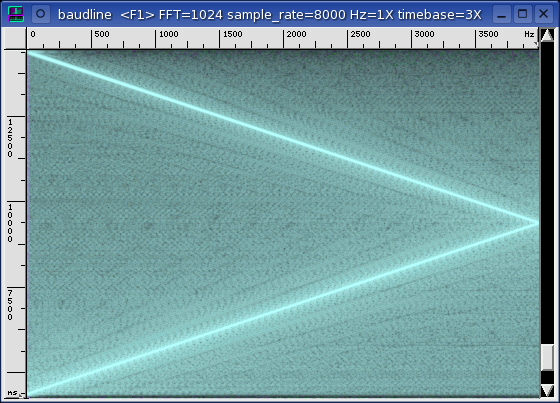
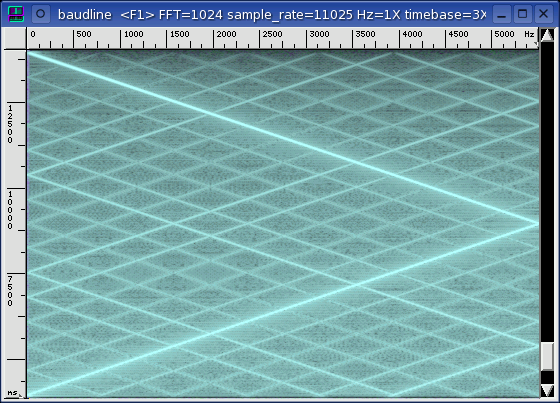
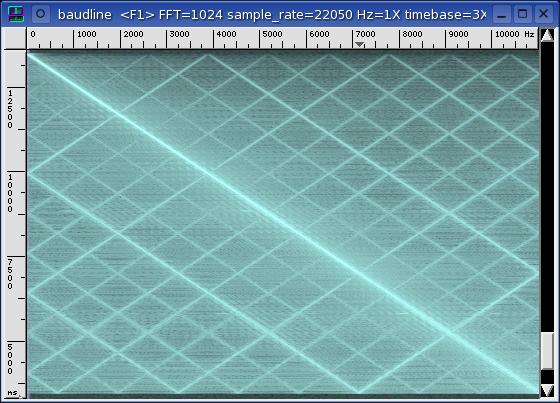
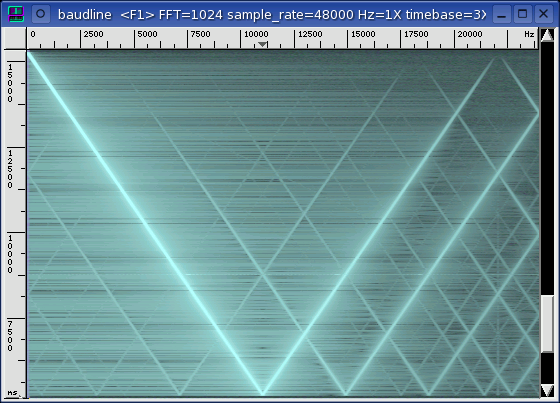
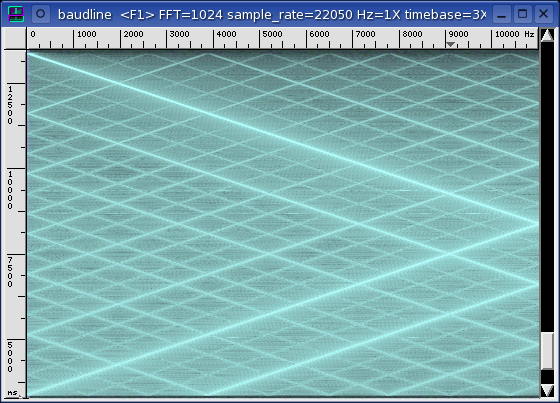
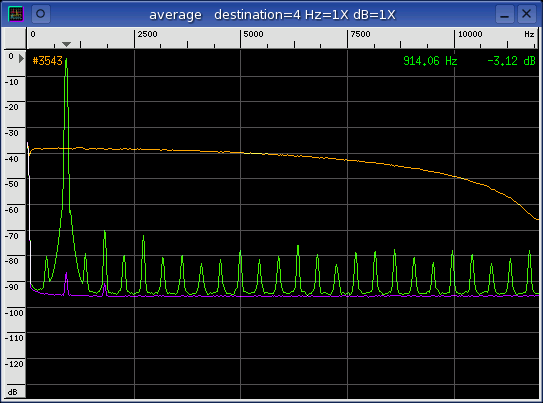
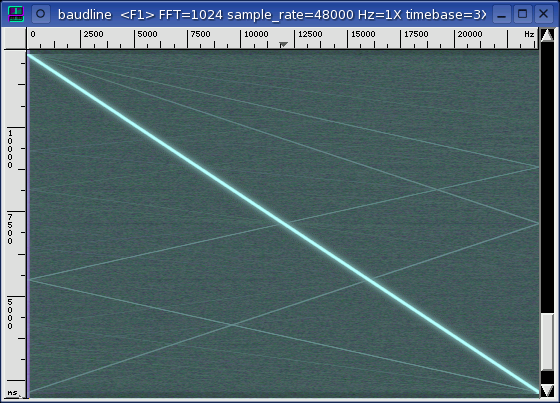
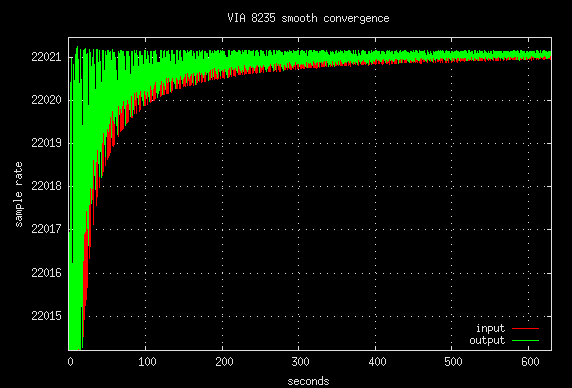
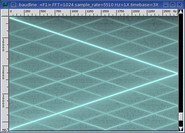
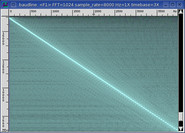
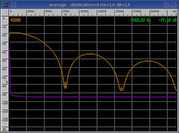
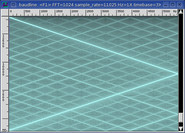
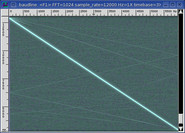
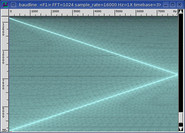
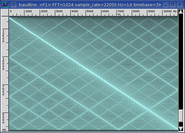
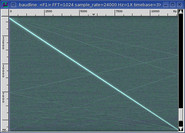
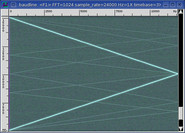
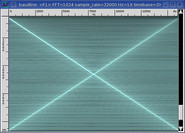
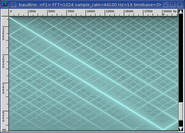
Below is the plot for the 22050 sample rate which shows a nice clean
convergence. All of the VIA 8235's sample rates display this respective
shape and behavior. This signifies the via82xx driver is handling the
fragment interrupts properly.
|
|
|
|
Frequency Domain
|
The sound card's input and output jacks are connected with a short external
cable and run in full duplex mode. This is a loopback test and baudline's
tone generator is the signal source. Distortion, noise floor, filter
response, and inter channel crosstalk are the frequency domain measurements of
interest in this section.
The signal test sources are a pure sine wave, a linear sine sweep, and
WGN. The sine wave is
used for the distortions and crosstalk measurements. The linear sine
sweep and WGN are used for the filter characterization measurement.
Both are an application of the
swept sine vs. WGN technique
and are equivalent measures of the frequency response.
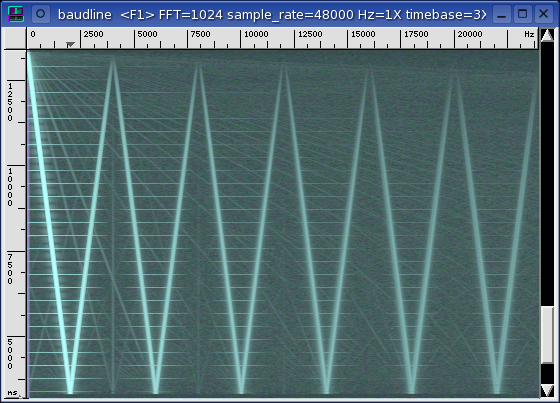
Since spectral performance is a function of sample rate, each of the sound
card's native rates will be tested. The highest sample rate is usually
the cleanest and this is advantageous because it allows the isolated testing
of the ADC and the
DAC. The matched,
source, and sink sample rate combinations are described below.
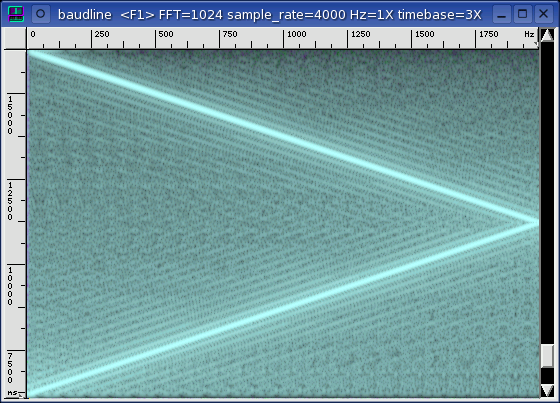
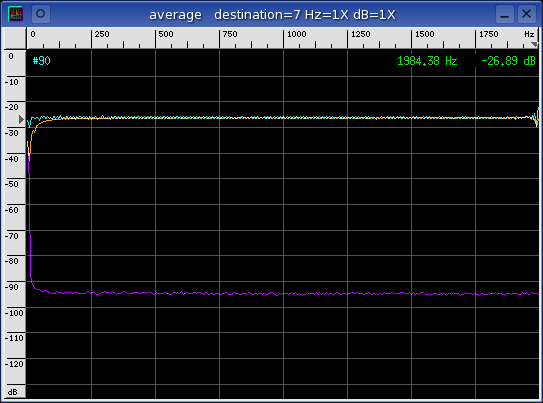
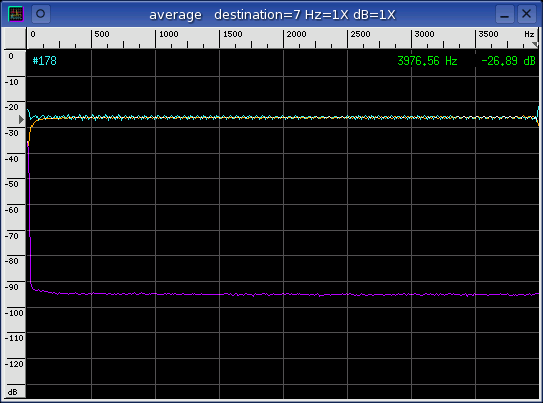
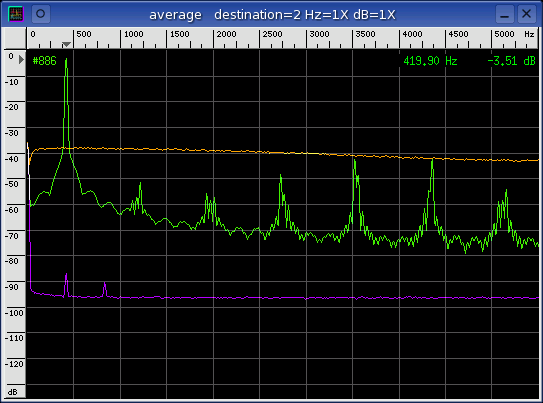
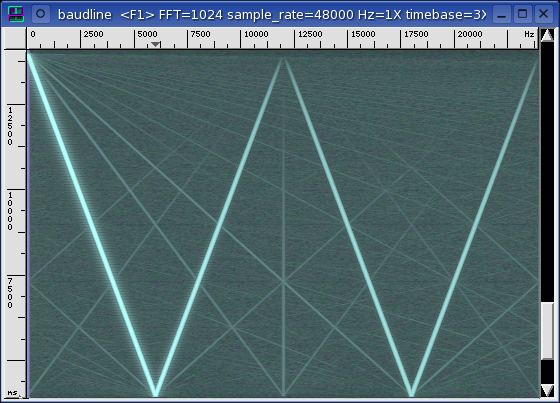
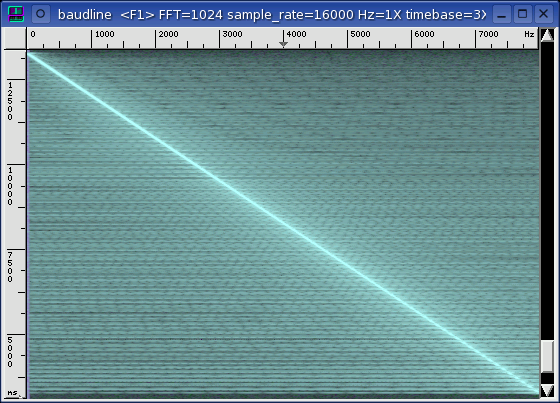
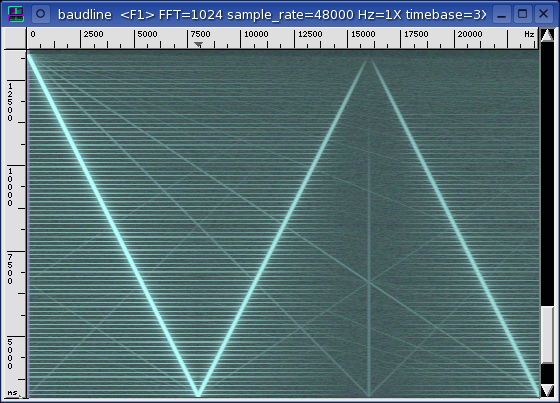
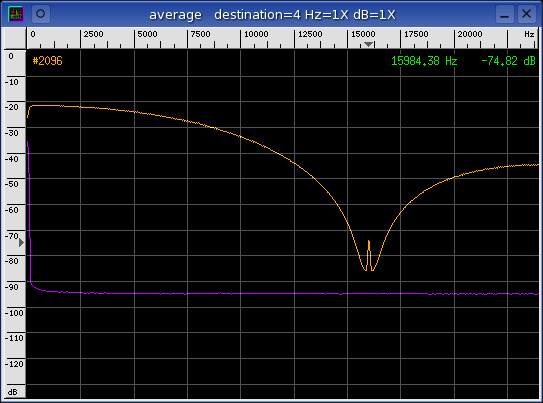
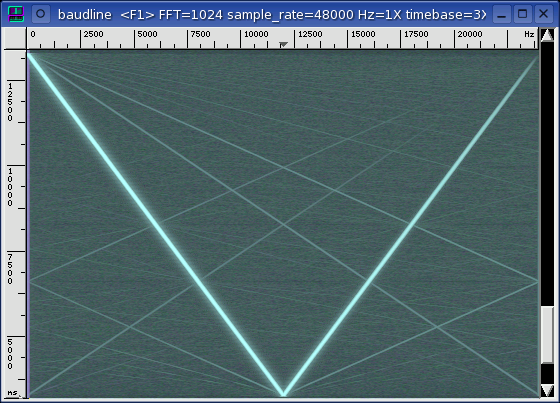
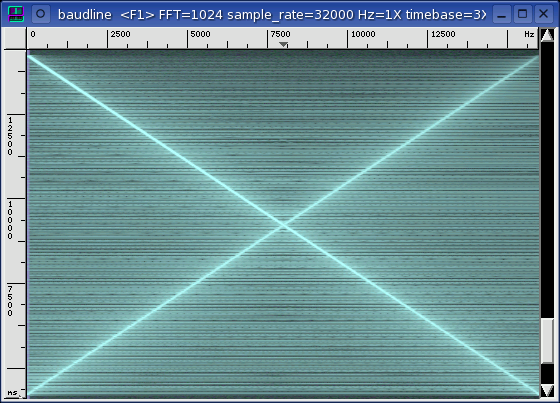
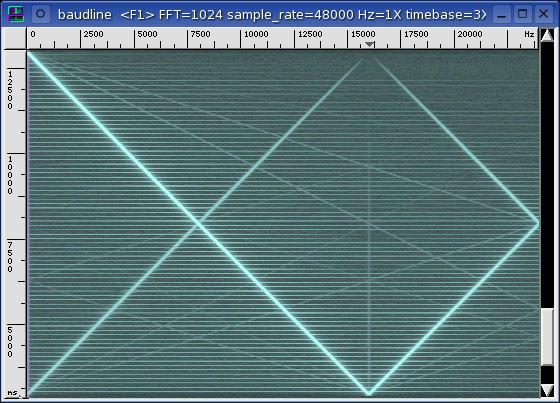
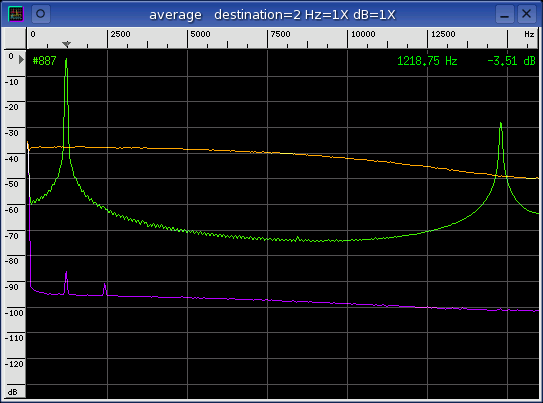
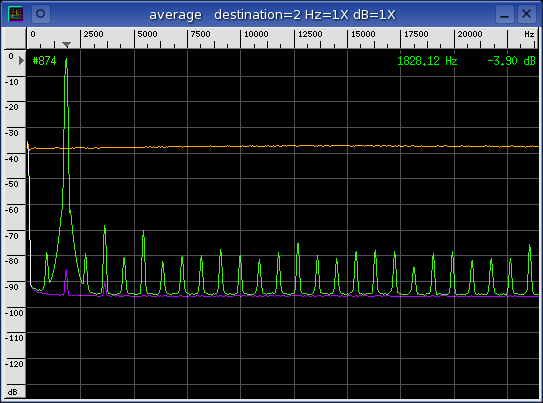
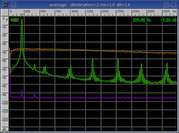
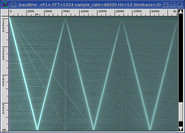
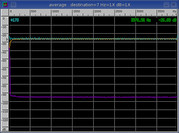
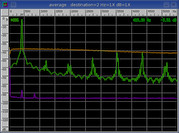
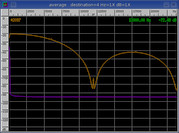
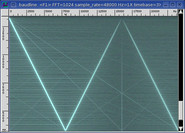
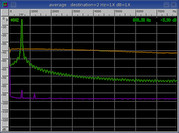
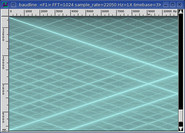
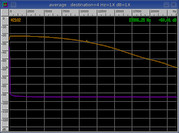
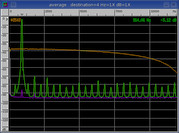
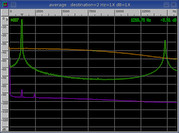
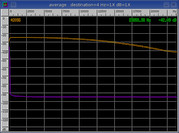
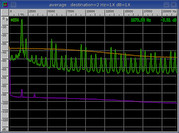
matched
The input and output sample rates are the same. This combination tests
the performance of both the ADC and the DAC in a matched mode of
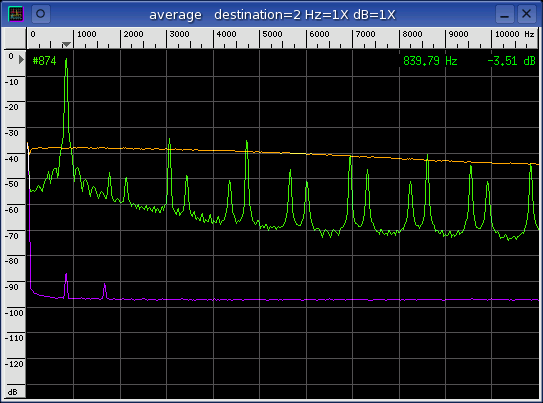
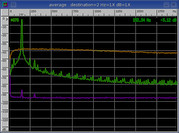
operation. The linear sine sweep signal in the left spectrogram display
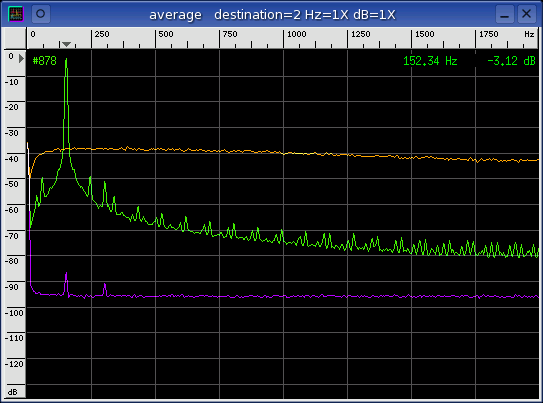
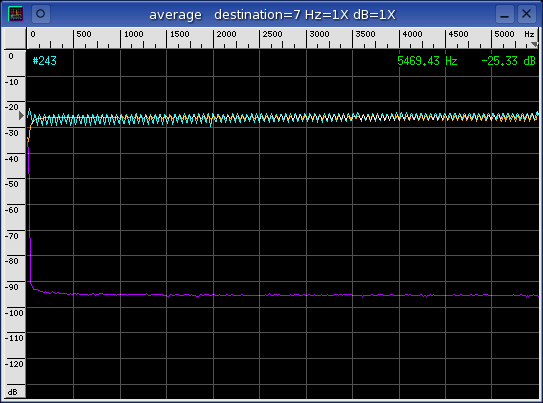
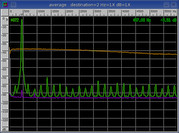
and the WGN (orange) in the Average window characterize the in-band filter
response. The sine wave (green) in the Average window is used for
distortion and crosstalk measurements. The sine leakage (purple) is used
for crosstalk measurement
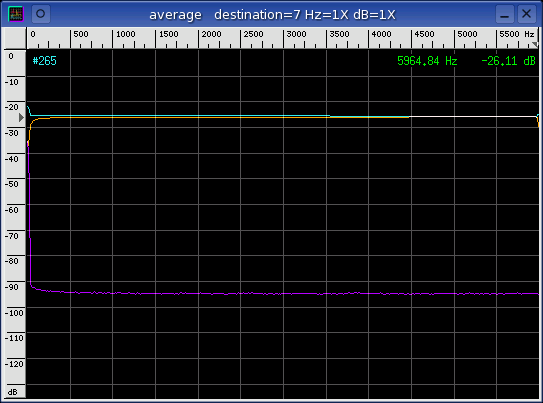
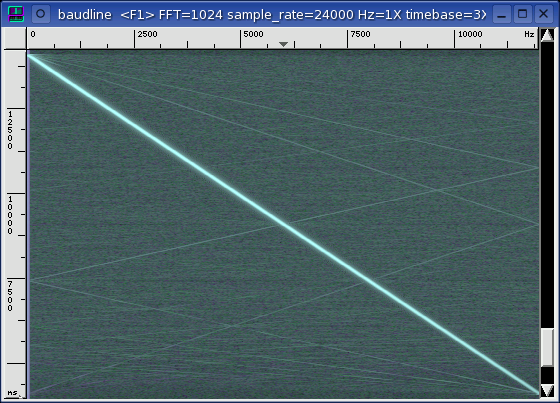
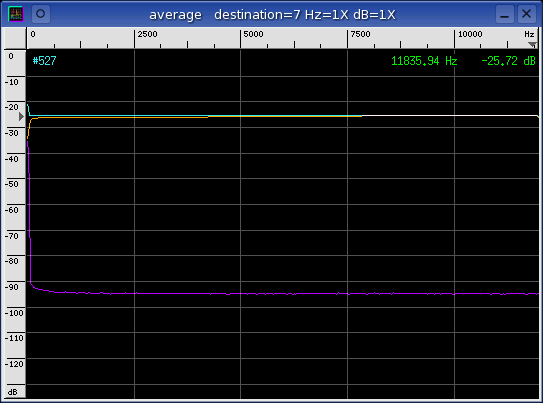
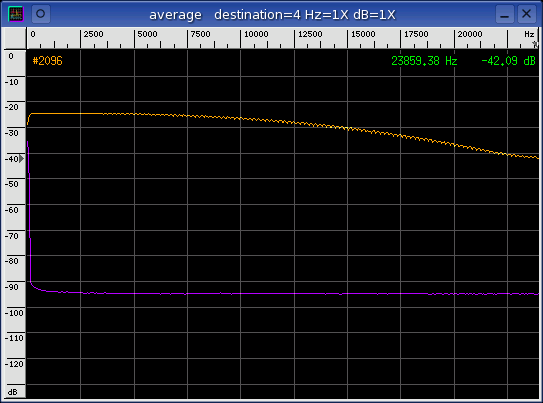
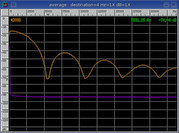
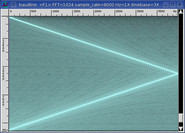
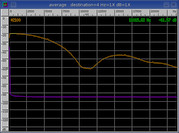
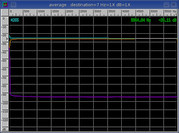
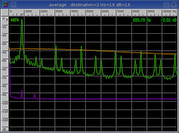
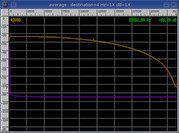
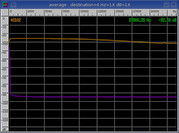
source
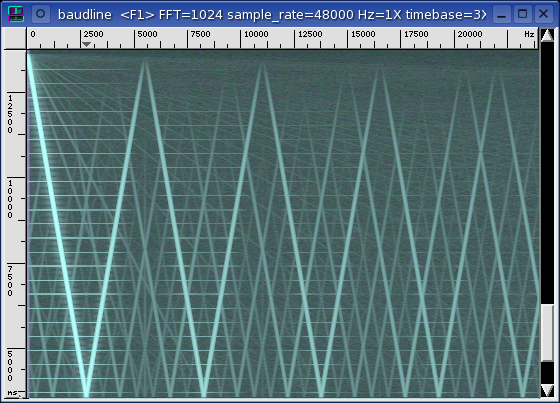
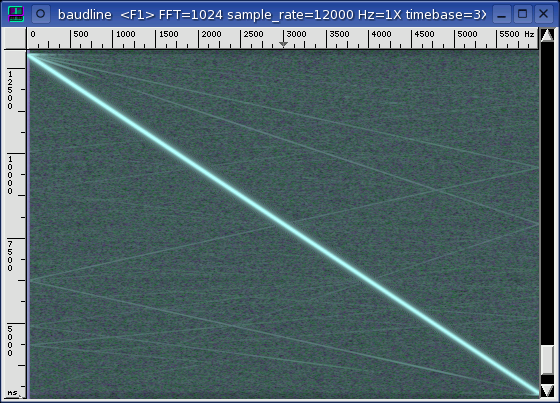
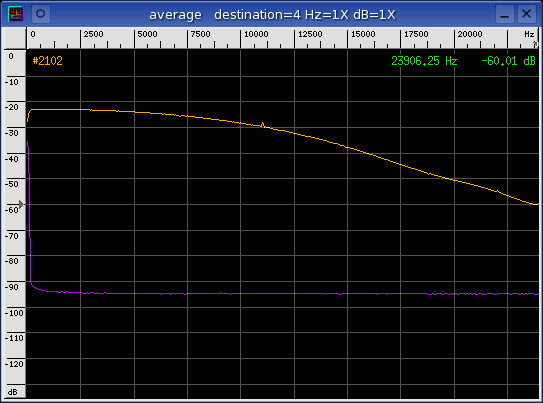
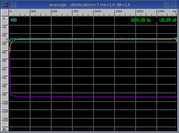
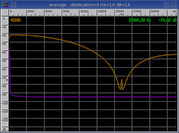
The sample rate of the input (sink) is the card's highest clean rate.
This combination tests the performance of the DAC. The linear sine sweep
signal in the middle spectrogram display characterizes the DAC filter
response. The position of the pass-band and the stop-band filter
transition is defined by the Nyquist frequency of the DAC. The noise
floor (purple) is the Average collection of a silent channel.
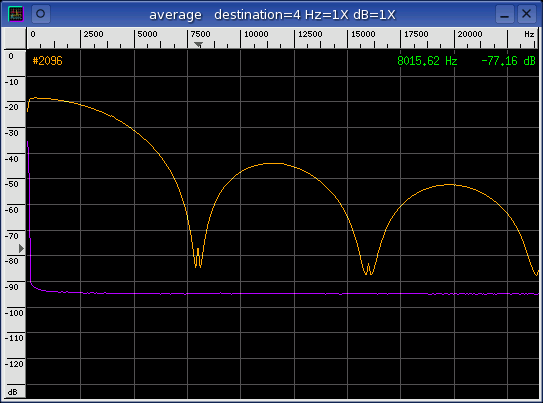
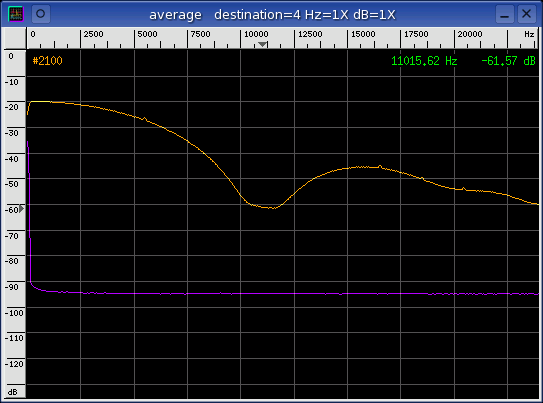
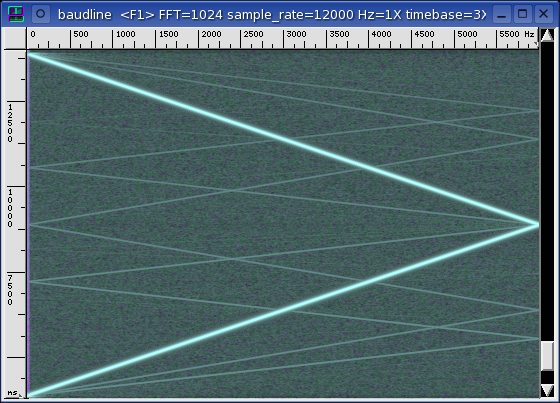
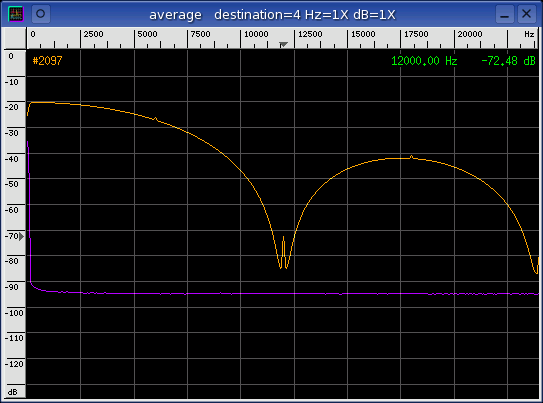
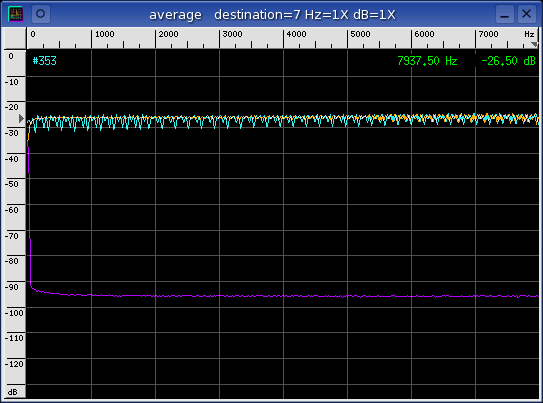
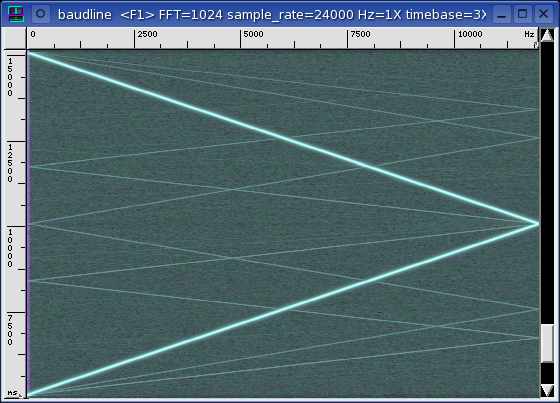
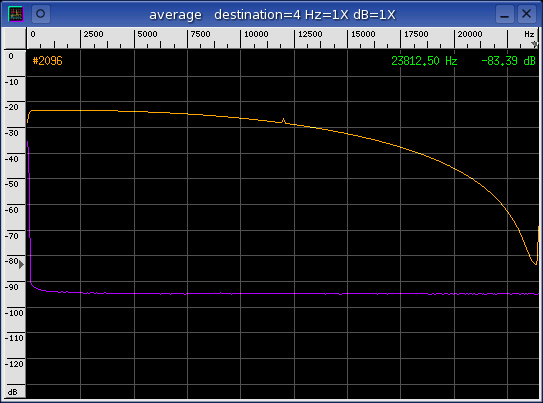
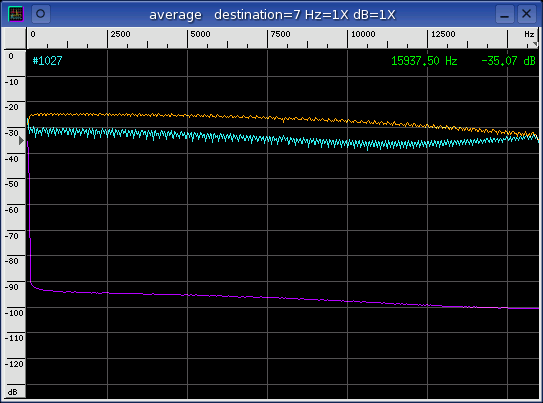
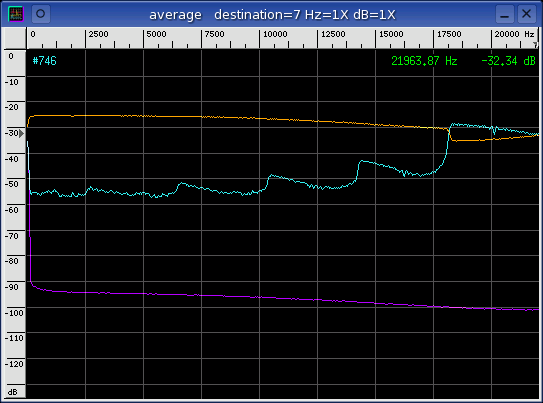
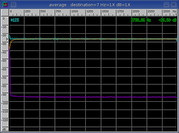
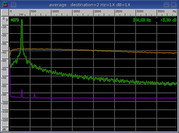
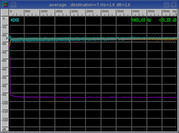
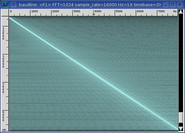
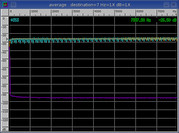
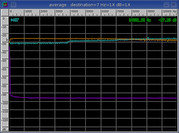
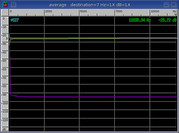
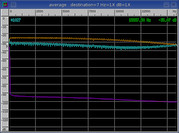
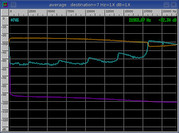
sink
The sample rate of the output (source) is the card's highest clean rate.
This combination tests the performance of the ADC. The linear sine sweep
signal in the rightmost spectrogram display and the orange curve in the Average
window below it characterize the ADC filter response. The position of
both the pass-band and the stop-band filter transition is defined by time in
the spectrogram and by folded frequency in the Average window. The orange Average curve represents the pass-band while the cyan curve is a folded
representation of the stop-band ADC filter response. The noise floor
(purple) is the Average collection of a silent channel.
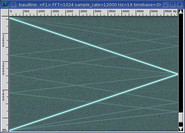
The naming convention for the columns below is (DAC -> ADC) where DAC
represents the source sample rate and ADC represents the sink sample
rate.
matched
|
source (DAC)
|
sink (ADC)
|
|
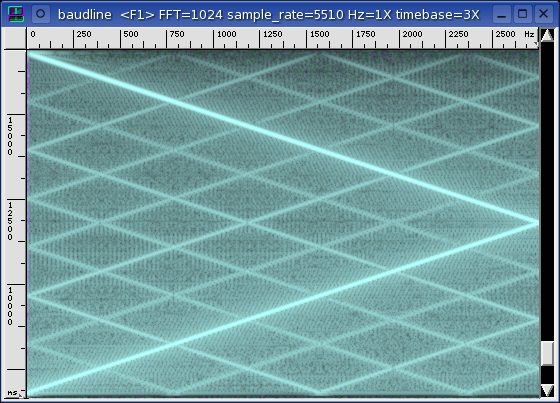
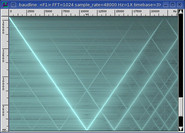
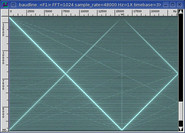
4000 -> 4000
|
4000 -> 48000
|
48000 -> 4000
|
|
|
|
|

|
|
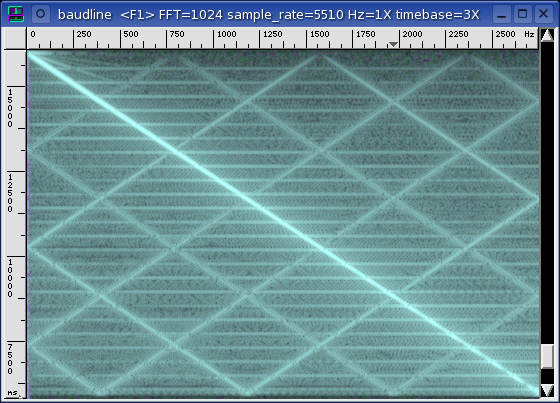
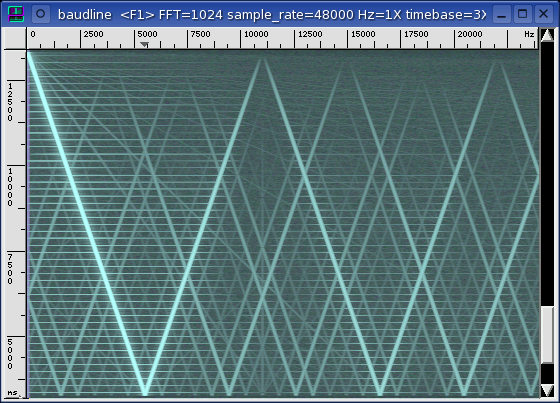
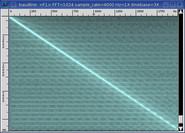
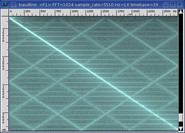
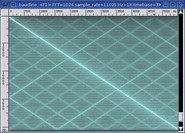
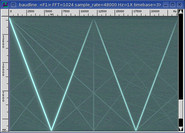
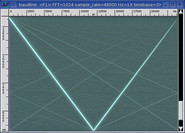
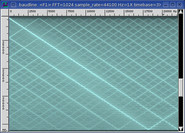
The wideband pulses in both the 4000 matched and source spectrogram
sweeps have a 0.382 second period (1528 samples).
|
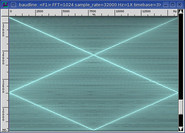
5510 -> 5510
|
5510 -> 48000
|
48000 -> 5510
|
|
|
|
|
|
|
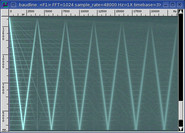
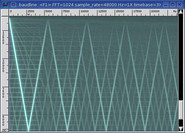
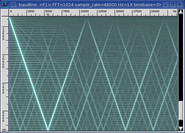
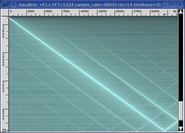
The wideband pulses in both the 5510 matched and source spectrogram
sweeps have a 0.410 second period (2259 samples).
|
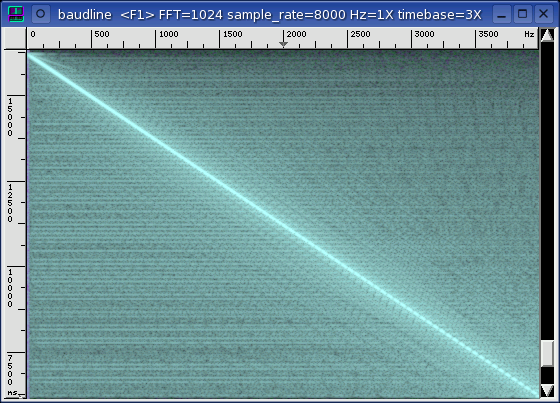
8000 -> 8000
|
8000 -> 48000
|
48000 -> 8000
|
|
|
|
|
|
|
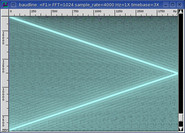
The wideband pulses in both the 8000 matched and source spectrogram
sweeps have a 0.128 second period (1024 samples).
|
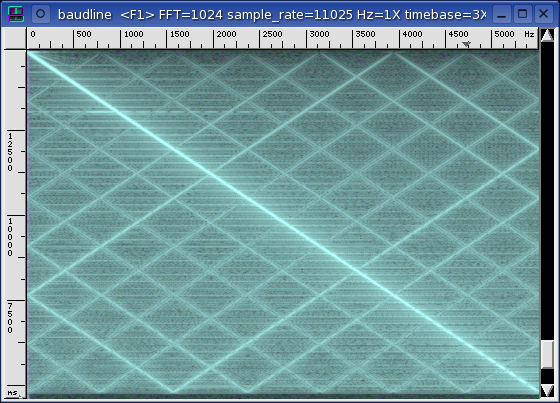
11025 -> 11025
|
11025 -> 48000
|
48000 -> 11025
|
|
|
|
|
|
|
The wideband pulses in both the 11025 matched and source spectrogram
sweeps have a 0.205 second period (2260 samples).
|
12000 -> 12000
|
12000 -> 48000
|
48000 -> 12000
|
|
|
|
|
|
|
|
16000 -> 16000
|
16000 -> 48000
|
48000 -> 16000
|
|
|
|
|
|
|
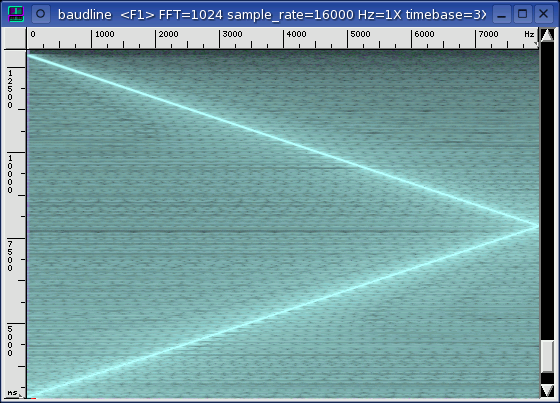
The wideband pulses in both the 16000 matched and source spectrogram
sweeps but the period is too fast to be able to measure accurately.
|
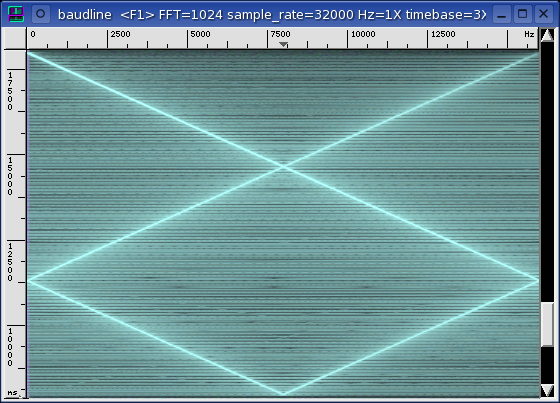
22050 -> 22050
|
22050 -> 48000
|
48000 -> 22050
|
|
|
|
|
|
|
|
24000 -> 24000
|
24000 -> 48000
|
48000 -> 24000
|
|
|
|
|
|
|
|
32000 -> 32000
|
32000 -> 48000
|
48000 -> 32000
|
|
|
|
|
|
|
The wideband pulses in the source spectrogram sweeps have a 0.128 second period.
|
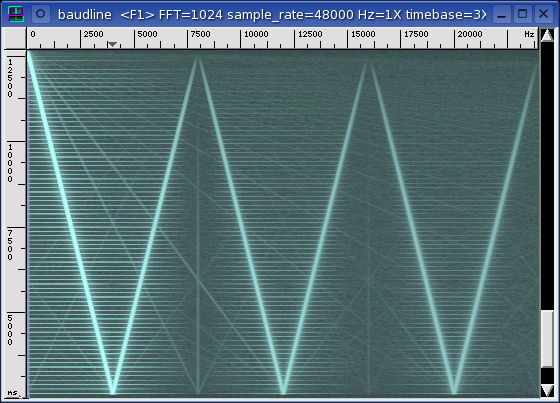
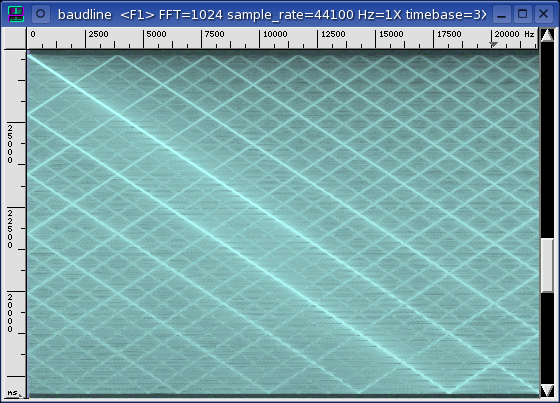
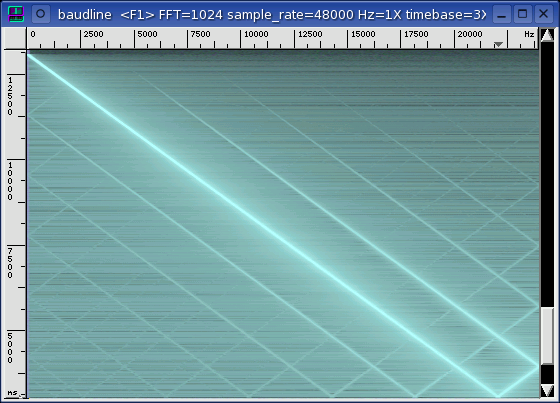
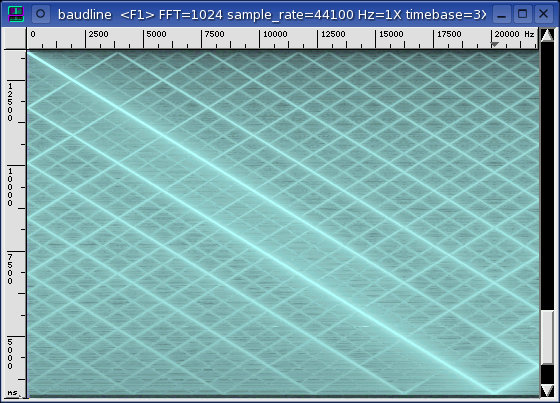
44100 -> 44100
|
44100 -> 48000
|
48000 -> 44100
|
|
|
|
|
|
|
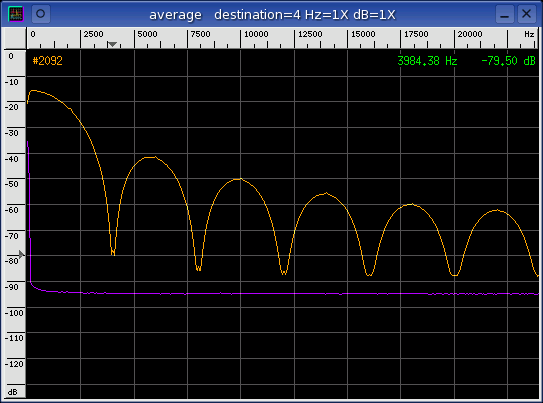
The 48000 filter looks like it doesn't have any high frequency roll-off.
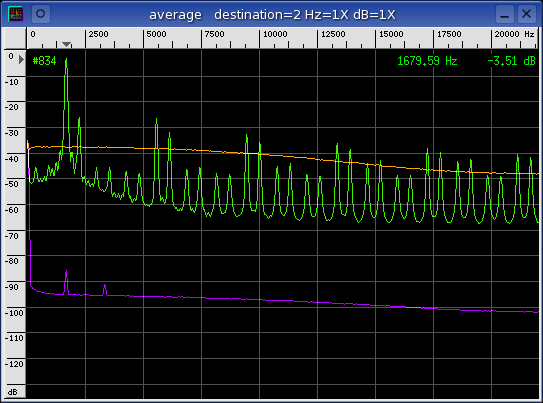
distortion
The following table of measurements were made using the technique described in
the sine distortion application
note. It is a full duplex test that uses a loopback of the tone generator
to measure the various distortion parameters. The stereo crosstalk
column is a measure of channel leakage that uses a sine wave channel and a
silent channel as the signal sources.
| rate |
SNR |
THD |
SINAD |
ENOB |
SFDR |
crosstalk |
|
| 4000 |
+39.69 dB |
-44.87 dB |
+38.54 dB |
+6.109 bits |
+44.05 dB |
-81.27 dB |
| 5510 |
+40.21 dB |
-48.50 dB |
+39.61 dB |
+6.287 bits |
+46.21 dB |
-81.55 dB |
| 8000 |
+37.49 dB |
-46.93 dB |
+37.02 dB |
+5.857 bits |
+42.30 dB |
-82.16 dB |
| 11025 |
+33.15 dB |
-48.23 dB |
+33.02 dB |
+5.191 bits |
+38.22 dB |
-82.52 dB |
| 12000 |
+63.72 dB |
-63.49 dB |
+60.59 dB |
+9.772 bits |
+69.92 dB |
-81.73 dB |
| 16000 |
+34.76 dB |
-47.20 dB |
+34.52 dB |
+5.441 bits |
+40.32 dB |
-80.75 dB |
| 22050 |
+25.86 dB |
-39.89 dB |
+25.70 dB |
+3.975 bits |
+31.60 dB |
-82.15 dB |
| 24000 |
+63.88 dB |
-61.87 dB |
+59.75 dB |
+9.632 bits |
+66.84 dB |
-80.61 dB |
| 32000 |
+23.60 dB |
-41.95 dB |
+23.54 dB |
+3.617 bits |
+23.62 dB |
-80.42 dB |
| 44100 |
+18.48 dB |
-29.20 dB |
+18.13 dB |
+2.718 bits |
+22.86 dB |
-81.04 dB |
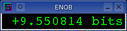
| 48000 |
+64.31 dB |
-60.89 dB |
+59.26 dB |
+9.551 bits |
+65.30 dB |
-81.37 dB |
The distortion measurements are a fair numeric representation of the test
signals that are depicted in the spectrum and spectrogram images above.
All the rates except 12000, 24000, and 48000 suffer from some major spectral
flaws. The flaws are in the form of wideband pulse, crosshatch aliasing,
folded aliasing, or a combination of all three. The 12000, 24000, and
48000 have the best distortion values.
The filters on the playback DAC side are very poor with minimal
rejection. The filters on the record ADC side are nonexistent.
The spectrogram sweeps and the average spectrum plots look surprisingly similar
to the SiS 7012 audio device which also
uses a Realtek codec.
|
|
|
|
Quantization |
A white Gaussian noise signal source was generated and captured in full
duplex loopback fashion at each of the standard sample rates. The
Histogram plots below
show a unique sample distribution that is dependent on sample rate.
The purple and green Gaussian histogram shapes are separated because of the
large inter channel difference of DC offsets.
12000, 24000, 48000
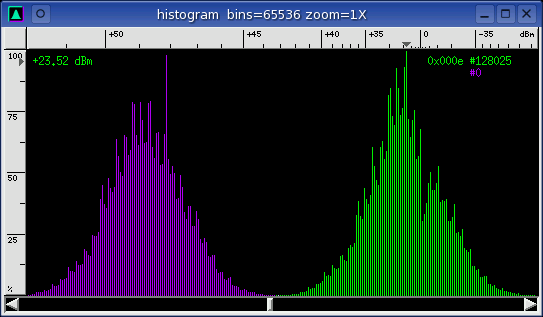
Every even sample value is zero as if the
LSB is fixed in the off
position. This transforms a 16 bit ADC into a 15 bit ADC. The
histogram spikes have a very interesting shape and are very periodic with a
two high then two low cadence pattern. Realtek claims the ALC101 codec
is an 18-bit device.
4000, 5510, 8000, 11025, 16000
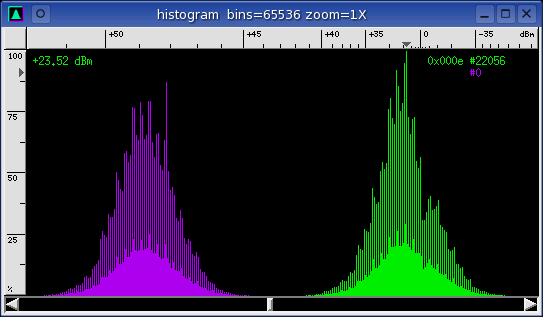
As the sample rate increases the solid histogram hump also increases in
size. The effect of the zeroed LSB is clearly evident in this family of
histogram plots. The same basic shape and spike pattern as in the
previous histogram.
22050, 32000, 44100
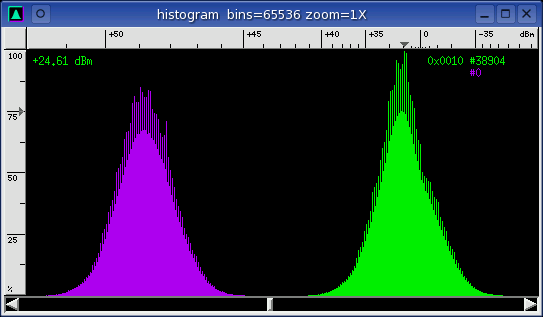
Very similar to the previous histogram but the solid lobe section is larger
and the original histogram shape is harder to discern.
|
|
|
|
Channel Delay |
The VIA 8235 chipset has a zero sample inter channel delay.
|
|
|
|
Analysis |
The 12000, 24000, and 48000 rates have a zero PPM sample rate loop error,
clean spectrum / spectrogram sweeps, low distortion, and the same zeroed LSB
histogram plots. 48000 is the native rate and all the other sample rates
are derived from that. The 12000 and 24000 are implemented as simple
decimate by 4 and by 2 without any filtering. On the DAC side
interpolation is done with a low order filter for only about -20 dB of
rejection.
The large sample rate PPM in/out errors seem to correlate well with the
crosshatch aliasing found on the sink ADC side for the 4000, 5510, 11025,
22050, and 44100 rates. Not sure what the DSP connection is but it
probably has to do with the flawed algorithm that is performing the sample rate
conversion.
The zeroed LSB equivalent 15-bit converters probably aren't helping the +9.55
bit ENOB measurement.
|
|
|
|
Conclusion |
The filters on the playback DAC side are very poor with minimal
rejection. The filters on the record ADC side are nonexistent.
Only use the 48000 sample rate with the VIA 8235 chipset. All of the
other sample rates suffer from severe spectral damage. Audio playback at
44100 is not recommended with this chip.
|
|
|
|
|