|
|
|
Abstract |
Audio Compression Codecs
E. Olson, Oct 26 2005
Test, measure, and characterize the performance of various audio compression
codecs. Perform a loopback
test on the codecs by encoding and then decoding simple test signals. The
absolute frequency accuracy, frequency response, distortion, and quantization
measurements will be analyzed and compared.
|
|
|
|
Procedure |
In the spirit of the
full duplex DAQ comparison application
note:
- generate a reference test signal (0 dB gain, 8000 samples/second, 16 bit .wav file)
- stationary sine wave (301.99 Hz)
- linear sine sweep (10 seconds, 0 - 4000 Hz)
- white Gaussian noise (WGN)
- run it through a black box (the compression codec)
- measure the signal performance as described in:
|
|
|
|
Codecs |
 Baudline has native support for decoding most of the codecs in this test.
The unsupported codecs were run through an external decoder that created a
16-bit .wav file that was then analyzed by baudline. The following
compression codecs are the subject of this application note:
Baudline has native support for decoding most of the codecs in this test.
The unsupported codecs were run through an external decoder that created a
16-bit .wav file that was then analyzed by baudline. The following
compression codecs are the subject of this application note:
The following encoding programs and versions were used:
For a full description of the command line parameters used with the encoding
programs see the generation script.
|
|
|
|
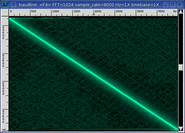
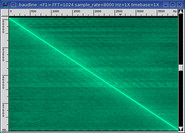
Clipping |
Sample clipping is a rich
generator of harmonics and distortion. Most of the compression encoders
can properly handle maximum amplitude (0 dB) signal sources. The faac,
oggenc, and speex encoders cannot.
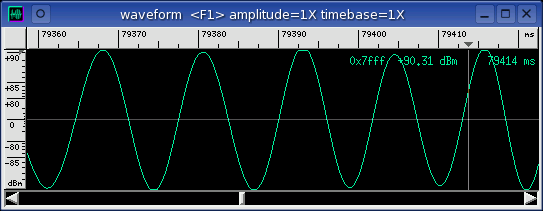
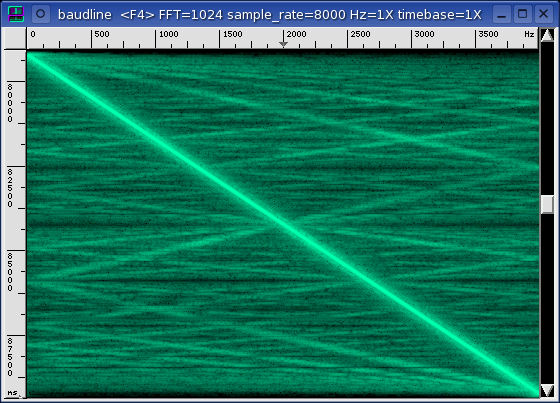
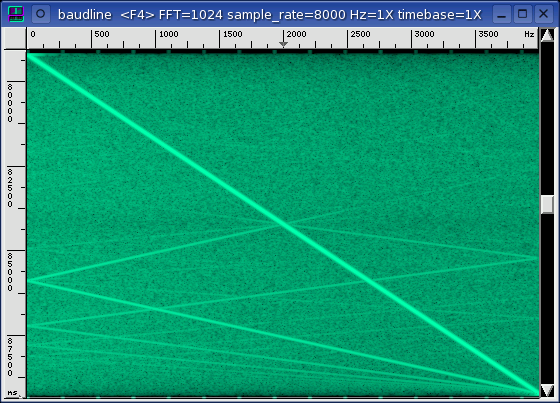
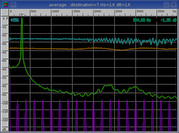
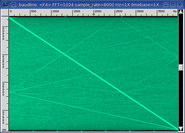
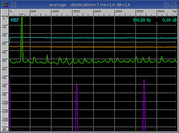
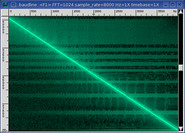
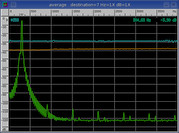
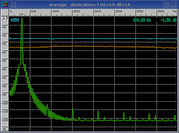
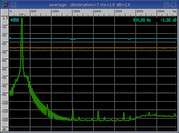
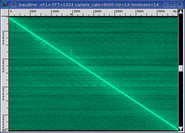
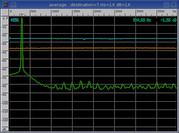
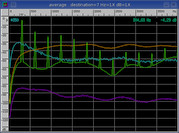
Above is a waveform clipping example that was generated by oggenc with the
"-q -1" command line option. The mild clipping of the tops and bottoms of
the linear sine wave sweep peaks might not look that bad but in fact the
situation is quite serious.
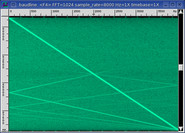
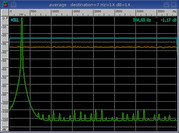
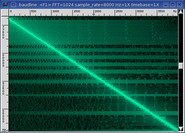
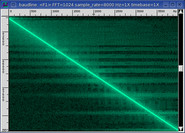
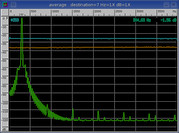
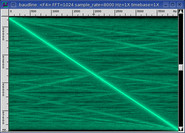 The spectrogram display on the right shows how severe the spectral damage is in
the frequency domain. The noise floor is high, the harmonic distortion is
running rampant, a lot of folded aliasing is present, and the ENOB is +7.688
bits. This is very poor performance and it shows how dangerous clipping
is to signal quality. Vorbis and the oggenc encoder clearly do not work
well with a maximum amplitude (0 dB) signal source.
The spectrogram display on the right shows how severe the spectral damage is in
the frequency domain. The noise floor is high, the harmonic distortion is
running rampant, a lot of folded aliasing is present, and the ENOB is +7.688
bits. This is very poor performance and it shows how dangerous clipping
is to signal quality. Vorbis and the oggenc encoder clearly do not work
well with a maximum amplitude (0 dB) signal source.
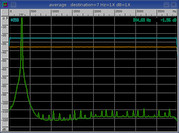
dB adjustment
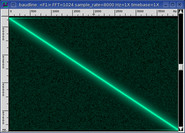
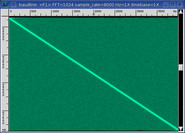
In an effort of fairness, the encoders that suffered from clipping were fed
reduced amplitude signal sources such that all clipping was eliminated.
This resulted in greatly improved distortion numbers and much cleaner looking
spectrograms for each of the affected codecs.
The incorrect processing of 0 dB strength inputs is a major encoder flaw that
will result in audible distortion for real world signals. Actually 0 dB
signals are very common with CD rips which makes this a serious problem.
Clipping near 0 dB is an issue that the encoder developers should address and
fix.
In the table below the mode column is either
CBR or
VBR which stands for constant or
variable bit rates. For the VBR codecs such as AAC, Vorbis, and Speex a
pure sine wave test signal was used for the bit rate kbps calculation.
The amplitude column is the digital gain dB setting of the Tone Generator
window that was used to create the test signal.
| codec and options |
bit rate |
mode |
encoder |
amplitude |
| PCM 16 |
128 kbps |
CBR |
native |
0 dB |
| PCM 8 |
64 kbps |
CBR |
sox |
0 dB |
| A-law |
64 kbps |
CBR |
sox |
0 dB |
| u-law |
64 kbps |
CBR |
sox |
0 dB |
| GSM 6.10 |
13 kbps |
CBR |
sox |
-1 dB |
| MS ADPCM |
32 kbps |
CBR |
sox |
0 dB |
| IMA ADPCM |
32 kbps |
CBR |
sox |
0 dB |
| G.721 ADPCM |
32 kbps |
CBR |
pvftormd |
0 dB |
| Rockwell ADPCM 2 |
16 kbps |
CBR |
pvftormd |
0 dB |
| Rockwell ADPCM 4 |
32 kbps |
CBR |
pvftormd |
0 dB |
| ZyXEL ADPCM 2 |
16 kbps |
CBR |
pvftormd |
0 dB |
| ZyXEL ADPCM 3 |
24 kbps |
CBR |
pvftormd |
0 dB |
| ZyXEL ADPCM 4 |
32 kbps |
CBR |
pvftormd |
0 dB |
| MP3 -b 8 |
8 kbps |
CBR |
lame |
0 dB |
| MP3 -b 16 |
16 kbps |
CBR |
lame |
0 dB |
| MP3 -b 24 |
24 kbps |
CBR |
lame |
0 dB |
| MP3 -b 32 |
32 kbps |
CBR |
lame |
0 dB |
| MP3 -b 40 |
40 kbps |
CBR |
lame |
0 dB |
| AAC -q 10 |
5.744 kbps |
VBR |
faac |
-7 dB |
| AAC -q 100 |
8.985 kbps |
VBR |
faac |
-3 dB |
| AAC -q 500 |
18.94 kbps |
VBR |
faac |
-2 dB |
| Vorbis -q -1 |
4.312 kbps |
VBR |
oggenc |
-4 dB |
| Vorbis -b 8 |
5.287 kbps |
VBR |
oggenc |
-1 dB |
| Vorbis -b 16 |
5.974 kbps |
VBR |
oggenc |
-1 dB |
| Vorbis -b 24 |
7.590 kbps |
VBR |
oggenc |
-1 dB |
| Vorbis -b 32 |
9.951 kbps |
VBR |
oggenc |
-1 dB |
| Vorbis -b 42 |
15.49 kbps |
VBR |
oggenc |
-1 dB |
| Speex q=0 |
2.240 kbps |
VBR |
speex |
-1 dB |
| Speex q=1 |
4.051 kbps |
VBR |
speex |
-3 dB |
| Speex q=2 |
6.065 kbps |
VBR |
speex |
-3 dB |
| Speex q=5 |
11.22 kbps |
VBR |
speex |
-3 dB |
| Speex q=9 |
18.47 kbps |
VBR |
speex |
-2 dB |
| Speex q=10 |
24.95 kbps |
VBR |
speex |
-1 dB |
| LPC-10 |
2.488 kbps |
CBR |
nuke |
0 dB |
| iLBC 30 ms |
13.33 kbps |
CBR |
iLBC_test |
-3 dB |
| iLBC 20 ms |
15.20 kbps |
CBR |
iLBC_test |
-3 dB |
AAC, Speex, and iLBC required fairly large dB adjustments to eliminate the
clipping. Most of the Vorbis runs needed only -1 dB of change but the
effect on performance was very significant. GSM 6.10 had very mild
clipping at 0 dB and the attenuation to -1 dB cleaned up some broadband
spikes that were visible in the spectrogram display.
The larger the dB adjustment, the more significant the problem of clipping with
real world signals. Extreme caution should be exercised with the
faac and speex encoders. Medium caution should be used with the toast
and oggenc encoders.
|
|
|
|
Frequency Domain |
The purpose of this section is to explore the frequency domain response and to
measure distortion. In the table below there are three groupings (top to
bottom) for each codec test run. A text label title and two screen dump
images.
title
Describes the codec under test and any configuration parameters. A number
such as 2, 3, 4, 8, or 16 represent encoding bit depth. Encoder command
line parameters can also be present in the codec titles. For example
"PCM 16" stands for linear PCM 16-bits per sample.
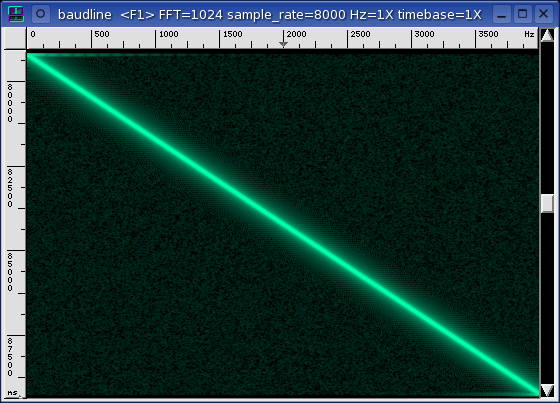
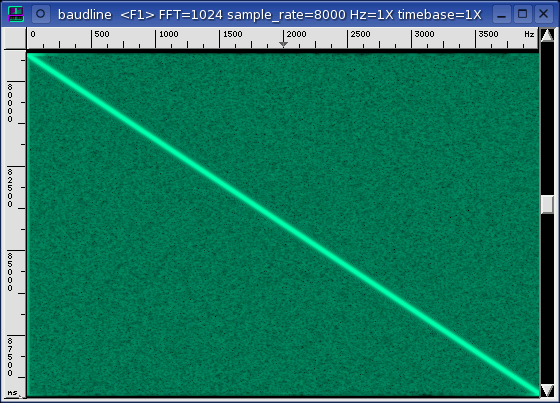
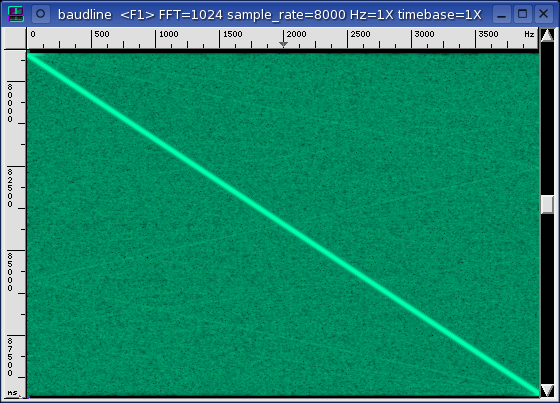
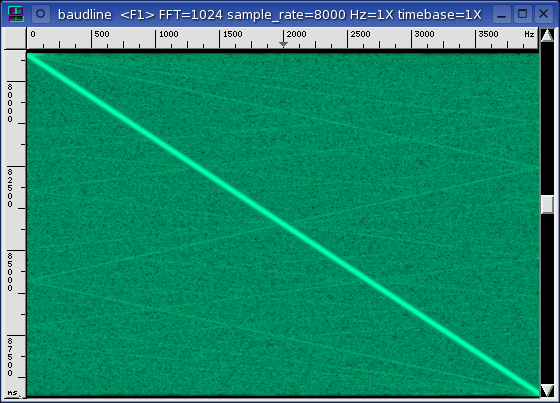
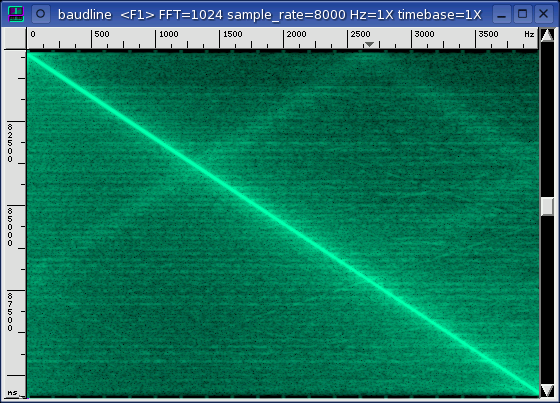
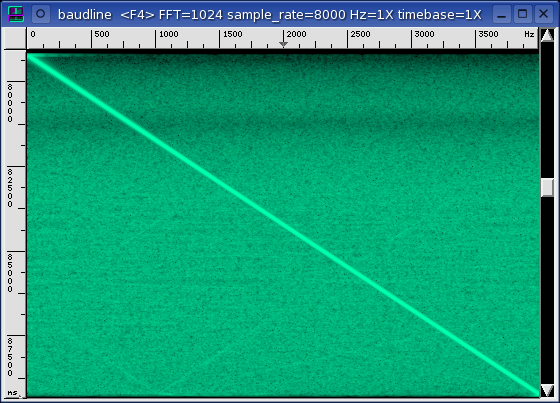
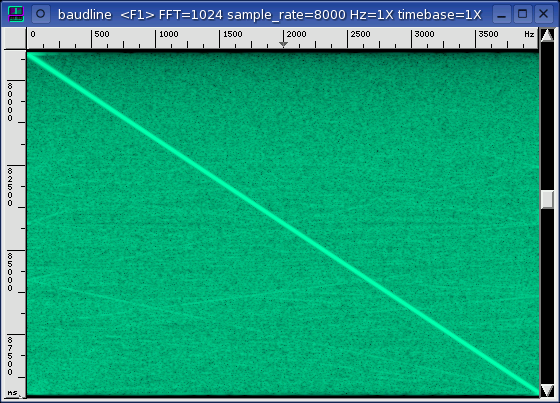
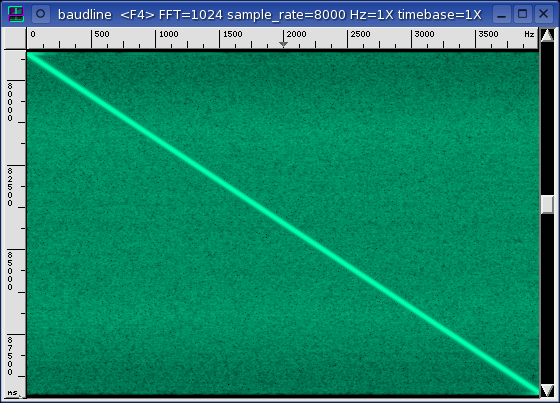
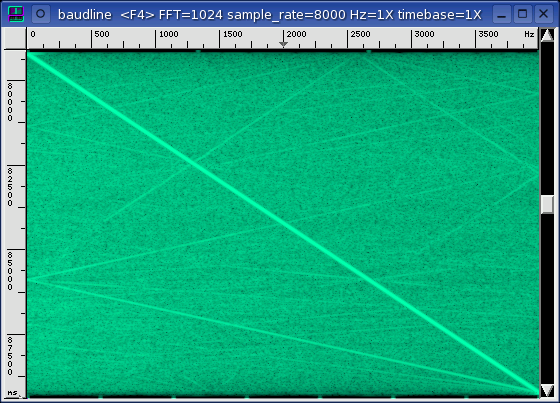
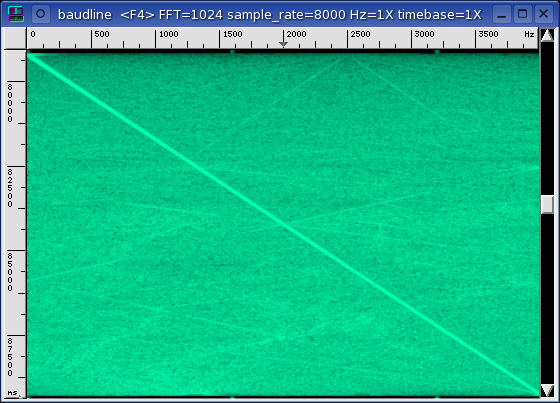
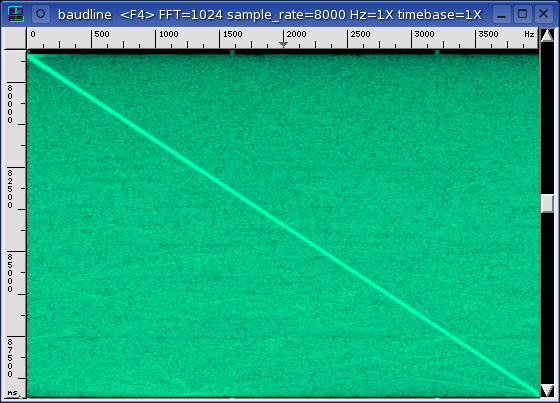
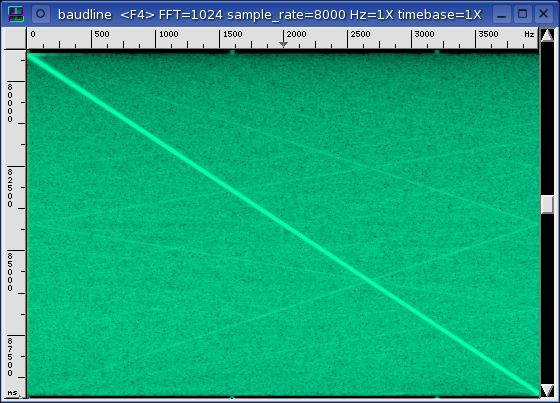
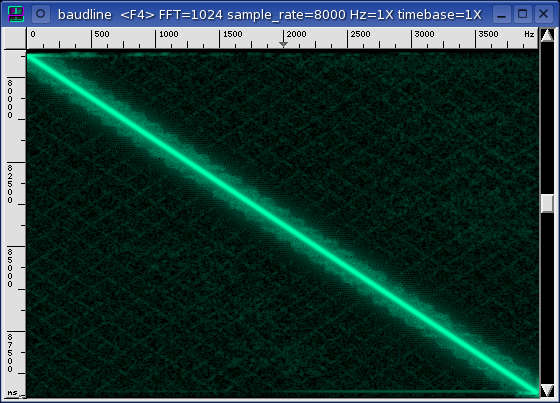
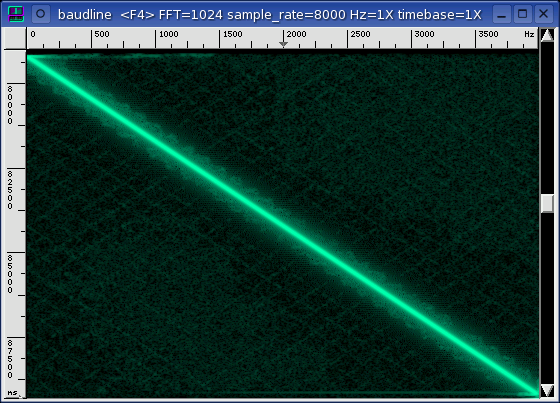
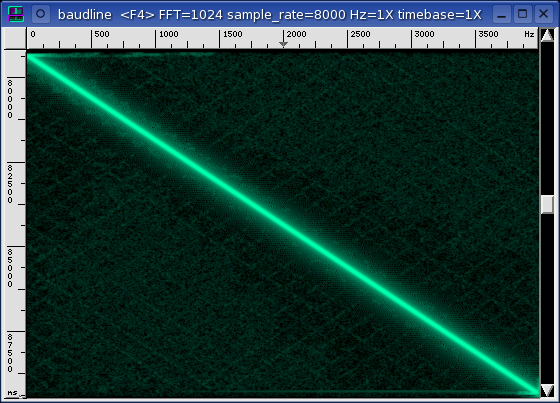
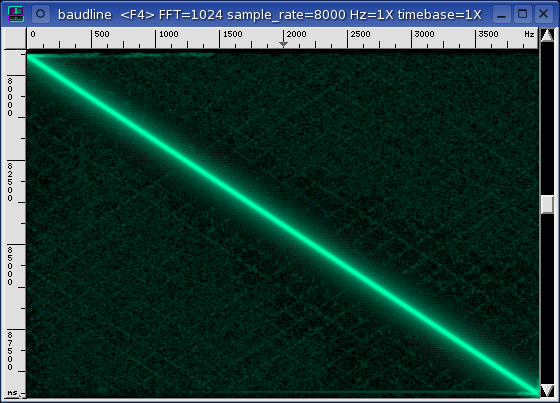
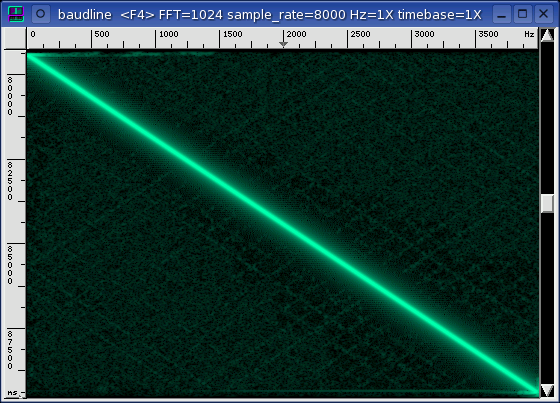
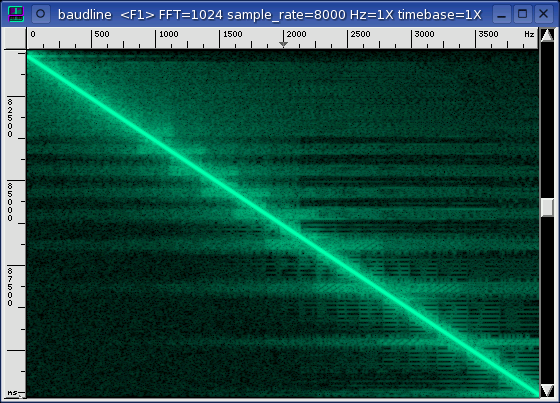
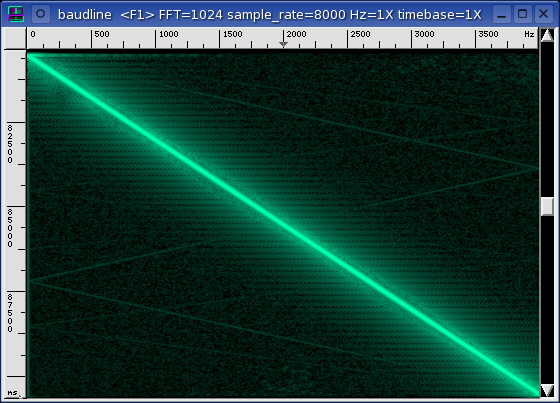
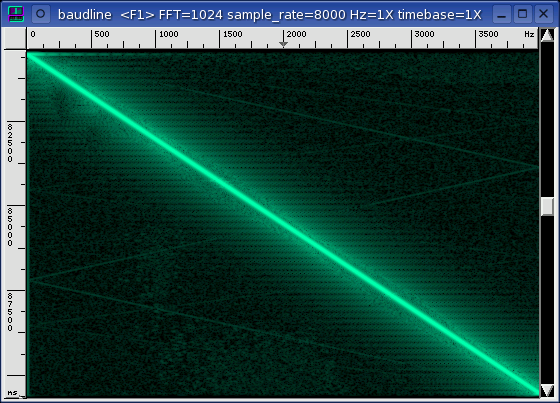
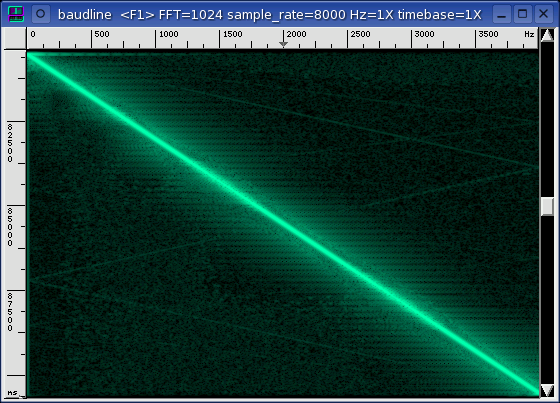
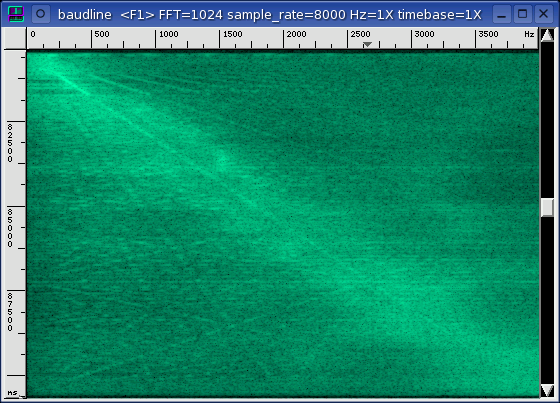
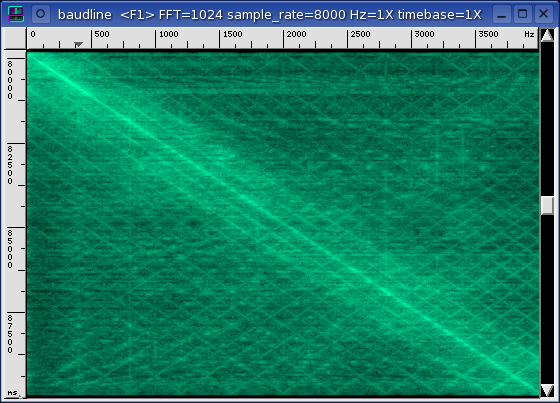
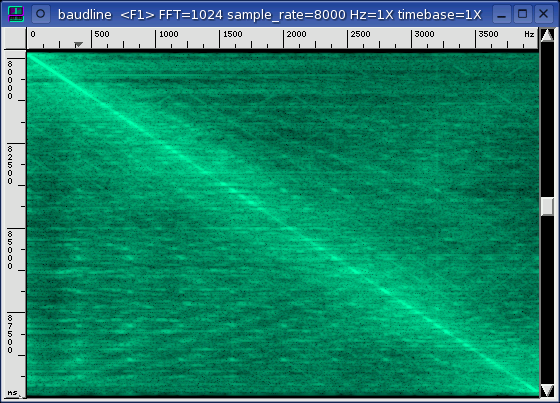
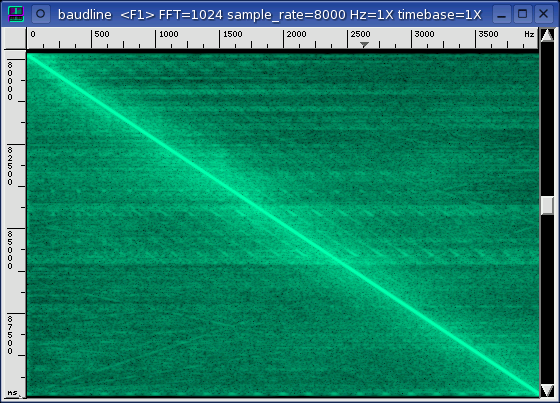
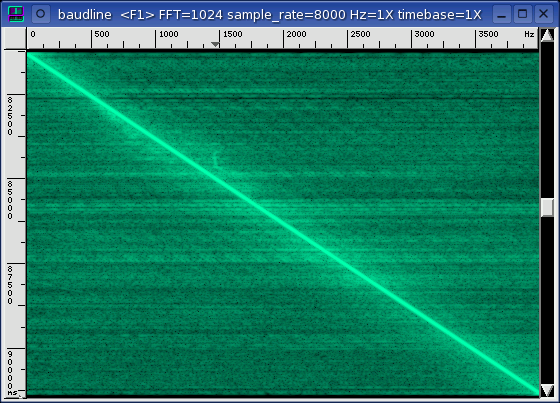
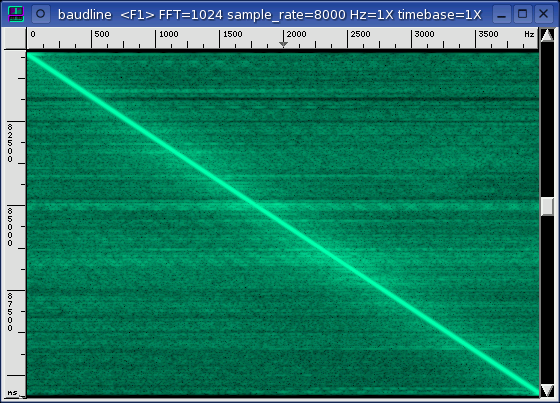
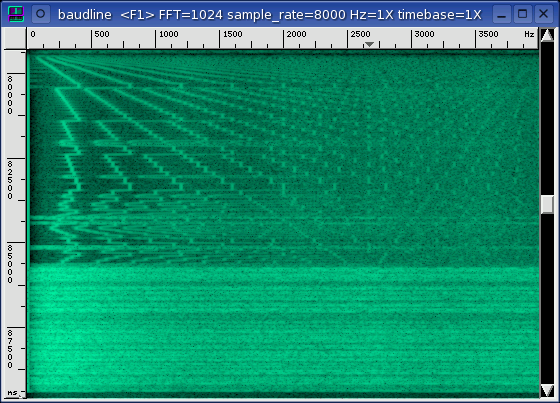
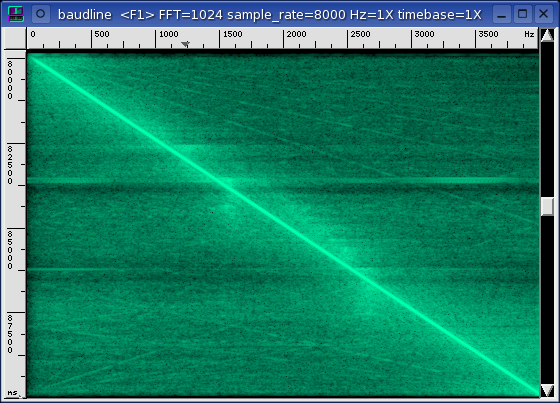
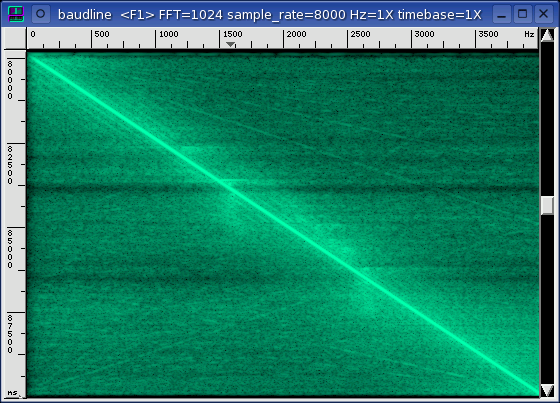
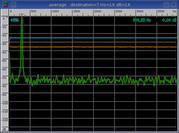
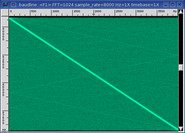
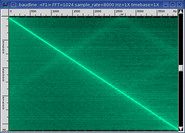
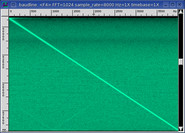
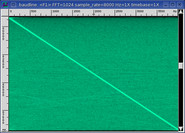
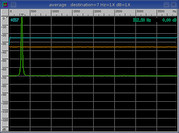
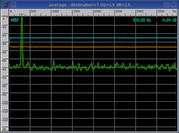
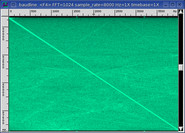
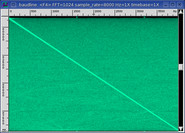
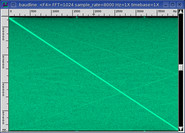
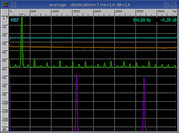
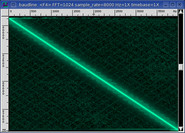
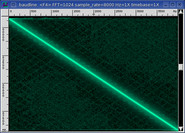
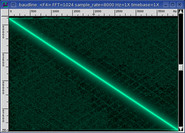
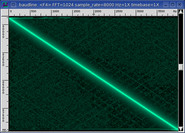
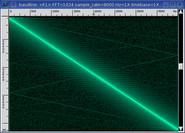
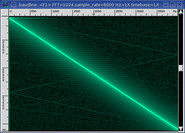
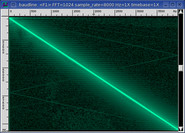
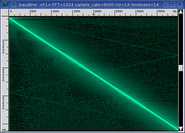
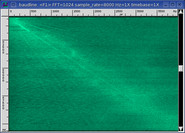
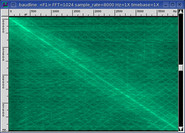
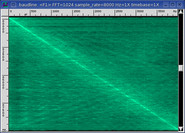
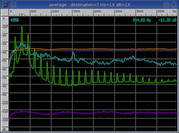
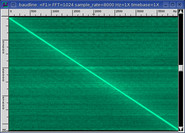
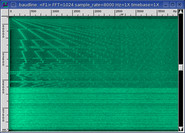
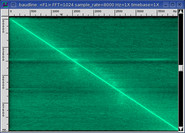
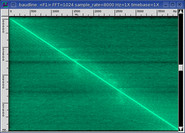
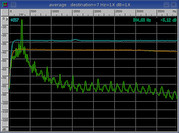
spectrogram
The spectrogram display
shows the 10 second 0 to 4000 Hz linear sine sweep. Noise floor
intensity, harmonics, alias folding, and other sorts of frequency dependent
distortion are visible.
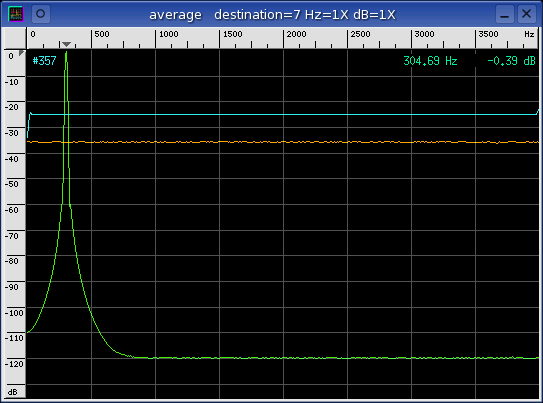
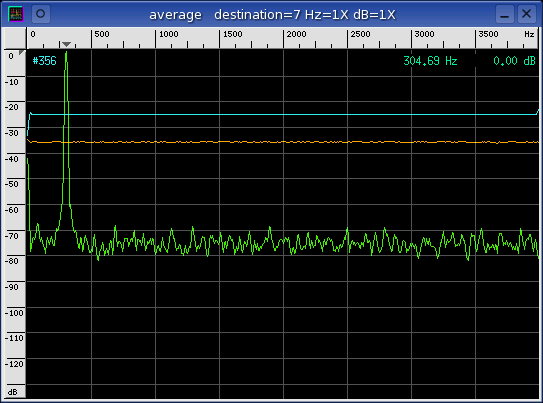
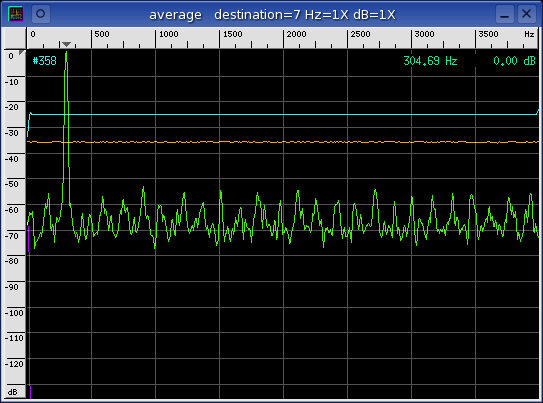
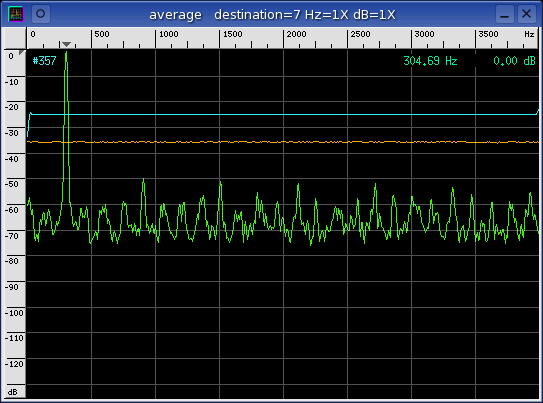
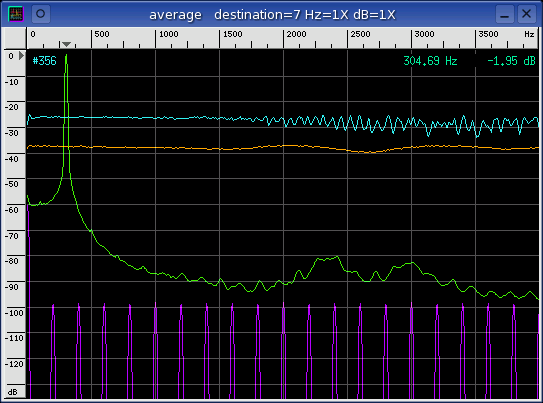
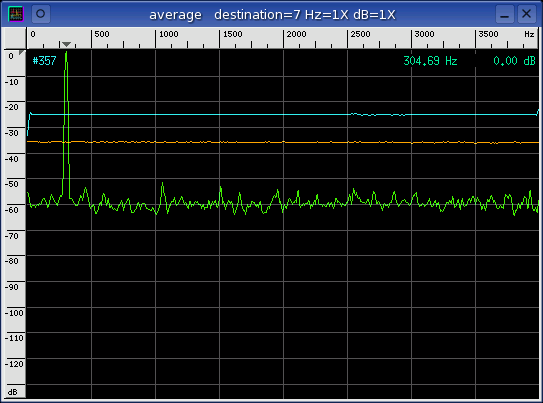
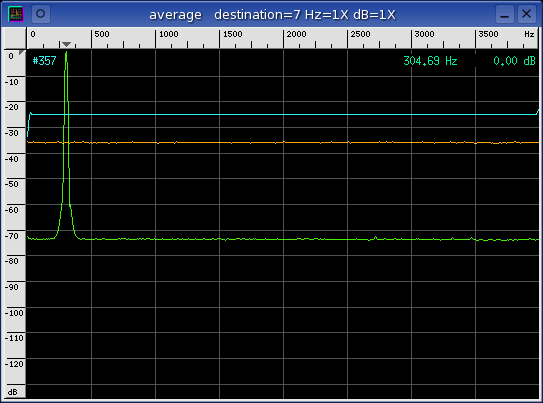
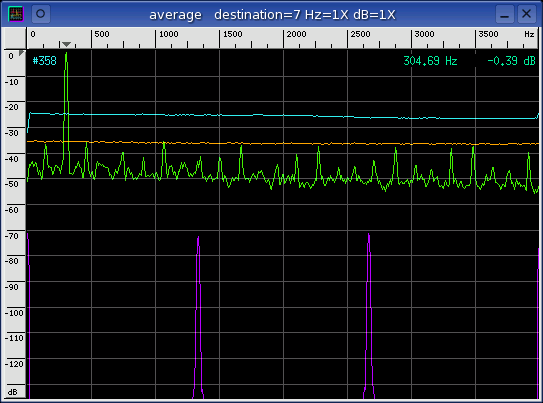
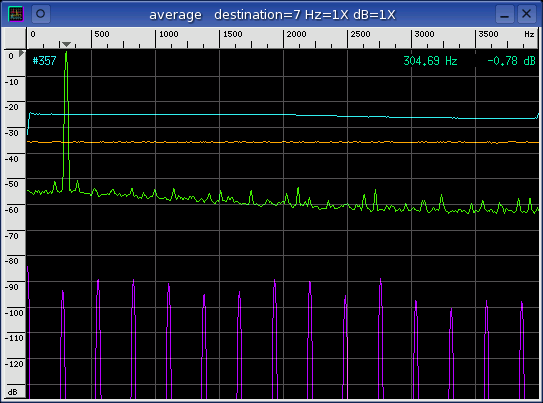
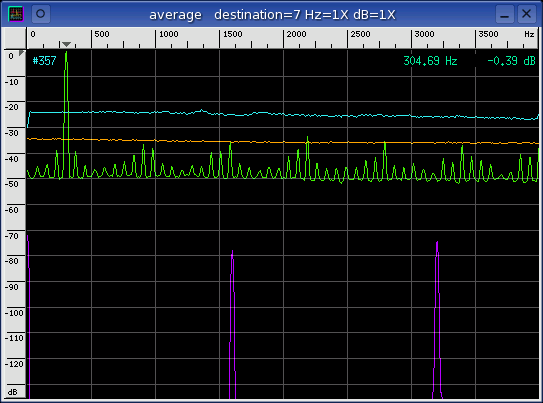
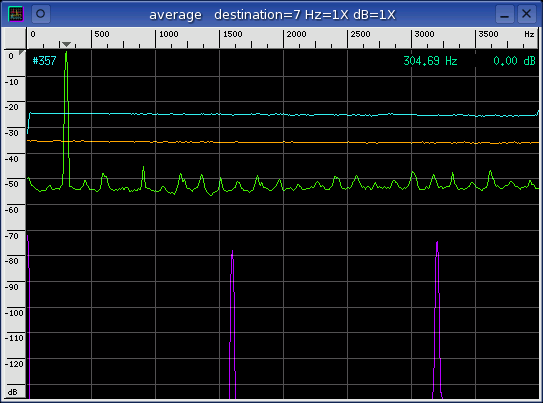
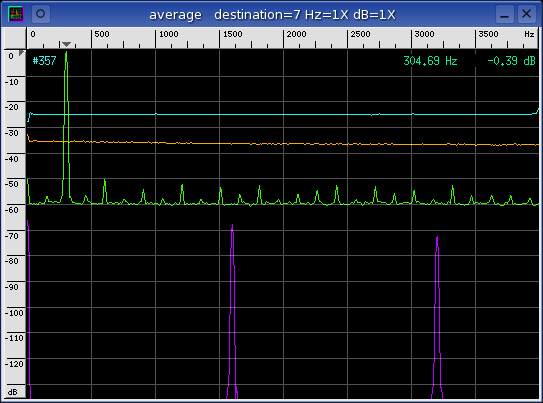
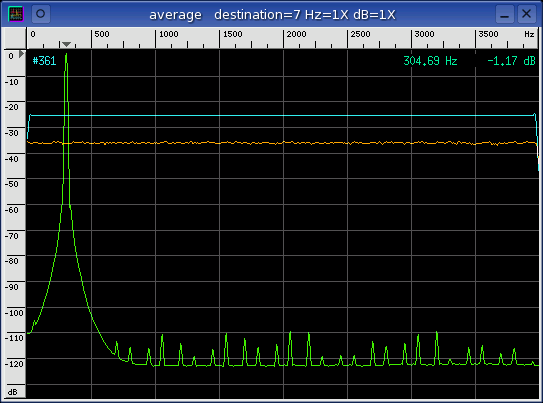
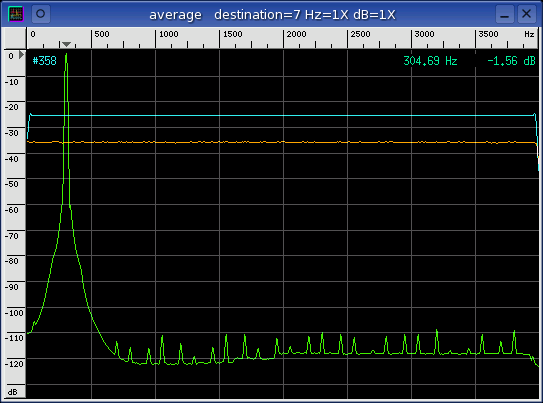
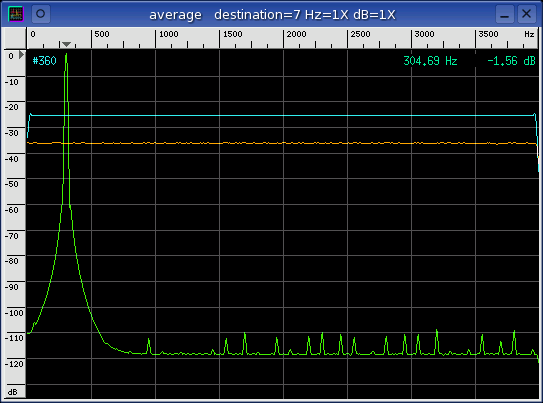
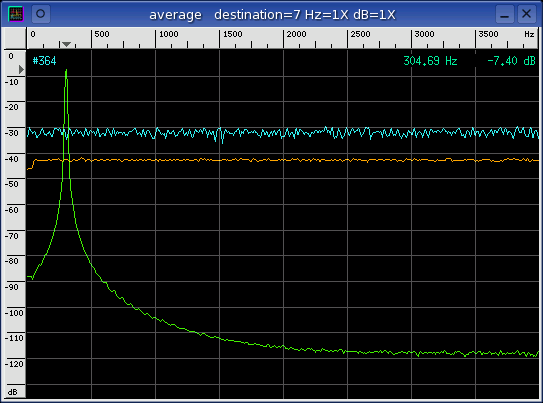
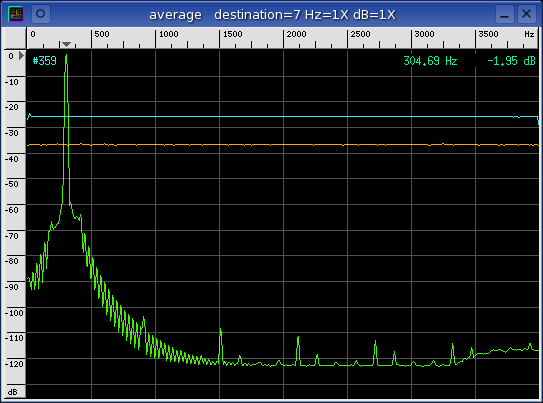
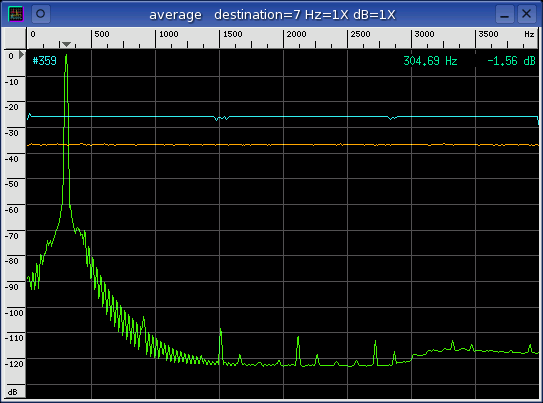
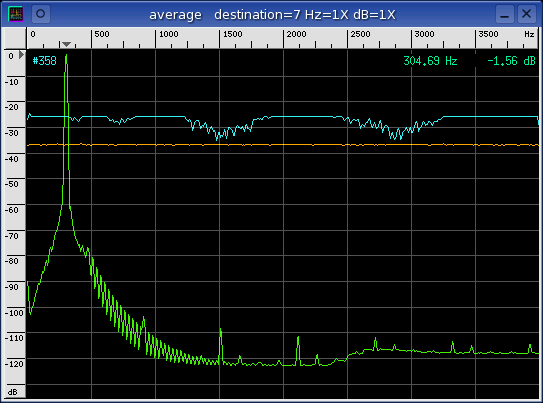
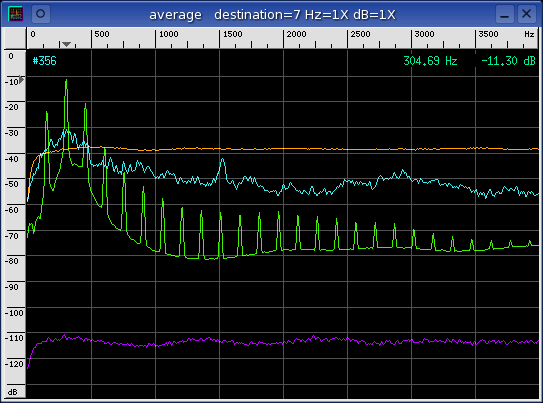
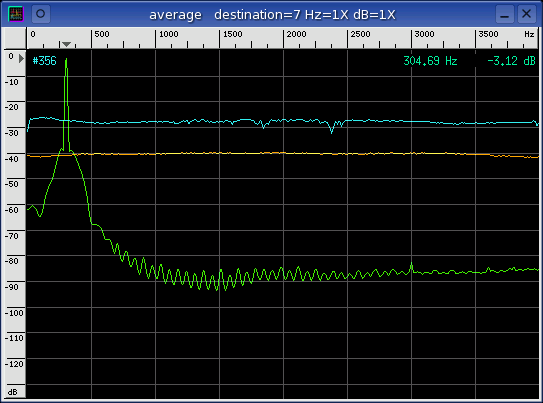
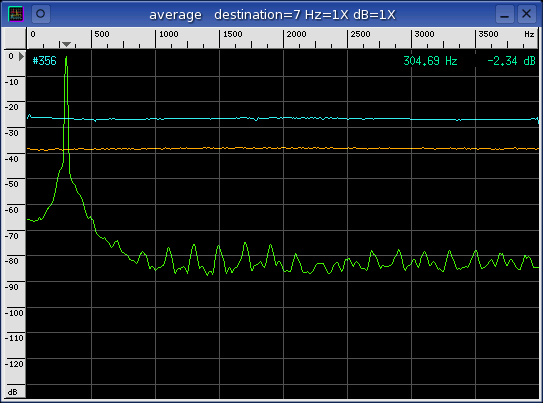
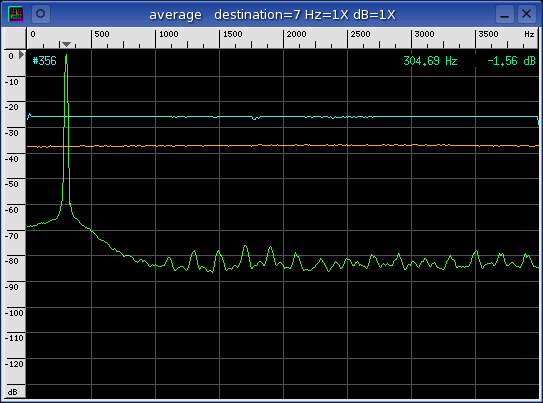
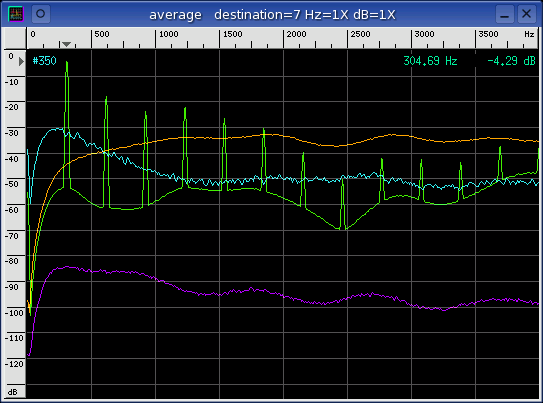
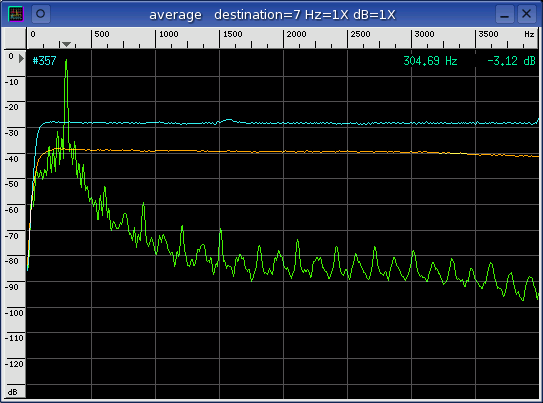
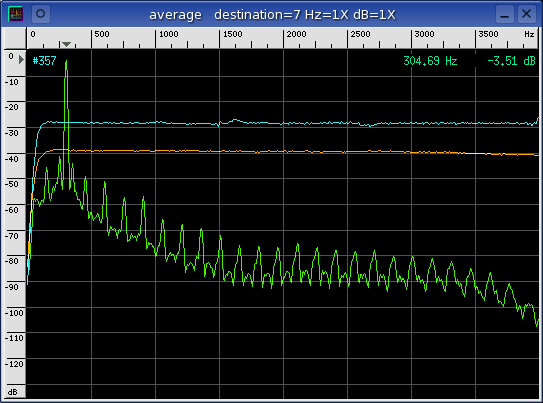
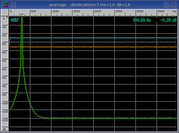
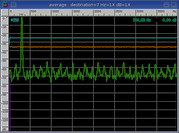
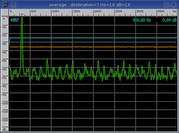
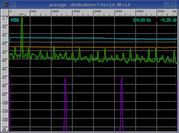
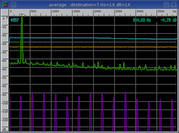
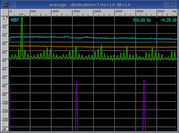
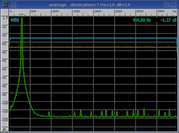
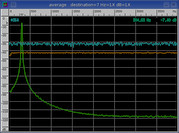
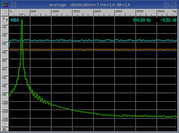
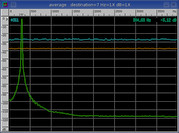
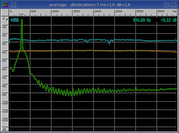
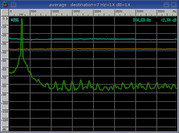
spectrum
Below the spectrogram is the
Average window which shows
the spectrum of the constant sine wave, linear sweep, WGN, and in some cases
the noise floor. The green curve is the sine which is also used for
the distortion measurements. The orange curve is the WGN and the cyan
curve is a copy-n-paste of the linear sine sweep. The occasional purple
curve is the noise floor.
The WGN and the linear sine sweep characterize the system frequency response
and for most codecs they are identical with the sweep being +10 dB
stronger. Codecs are complex machinery and when the WGN and sweep plots
differ in shape then something interesting and nonlinear is going on
inside. A flat response is ideal.
| PCM 16 |
PCM 8 |
|
|
|
|
|
|
|
|
| A-law |
u-law |
|

|
|
|
|
|
|
|
| GSM 6.10 |
MS ADPCM |
IMA ADPCM |
|
|
|
|
|
|
|
| G.721 ADPCM |
Rockwell ADPCM 2 |
Rockwell ADPCM 4 |
|
|
|

|
|
|
|
| ZyXEL ADPCM 2 |
ZyXEL ADPCM 3 |
ZyXEL ADPCM 4 |
|
|
|
|
|
|
|
| MP3 -b 8 |
MP3 -b 16 |
MP3 -b 24 |
|
|
|
|
|
|
|
| MP3 -b 32 |
MP3 -b 40 |
|
|
|
|
|

|
|
|
| AAC -q 10 |
AAC -q 100 |
AAC -q 500 |
|
|
|
|
|
|
|
| Vorbis -q -1 |
Vorbis -b 8 |
Vorbis -b 16 |
|

|
|
|
|
|
|
| Vorbis -b 24 |
Vorbis -b 32 |
Vorbis -b 42 |

|
|
|

|
|

|
|
| Speex q=0 |
Speex q=1 |
Speex q=2 |
|
|
|
|
|
|
|
| Speex q=5 |
Speex q=9 |
Speex q=10 |
|
|
|
|
|
|
|
| LPC-10 |
iLBC 30 ms |
iLBC 20 ms |
|
|
|
|
|
|
|
distortion
The following table of measurements were made using the
sine distortion technique to
measure the various SNR, THD, SINAD, ENOB, and SFDR metrics. See the
distortion measurement
window for more information. The Hz error column is a
measure of frequency accuracy that utilizes a method described in the
sample rate stability technique.
| codec |
SNR |
THD |
SINAD |
ENOB |
SFDR |
Hz error |
| PCM 16 |
+96.83 dB |
-103.72 dB |
+96.03 dB |
+15.657 bits |
+111.33 dB |
+0.2308 PPM |
| PCM 8 |
+50.70 dB |
-58.24 dB |
+49.99 dB |
+8.011 bits |
+62.73 dB |
+0.0202 PPM |
| A-law |
+42.19 dB |
-42.20 dB |
+39.19 dB |
+6.216 bits |
+50.96 dB |
+0.0192 PPM |
| u-law |
+42.20 dB |
-41.30 dB |
+38.72 dB |
+6.139 bits |
+48.59 dB |
+0.1556 PPM |
| GSM 6.10 |
+49.73 dB |
-64.39 dB |
+49.59 dB |
+7.944 bits |
+50.86 dB |
+2.9627 PPM |
* |
| MS ADPCM |
+46.34 dB |
-51.87 dB |
+45.27 dB |
+7.227 bits |
+61.50 dB |
+0.0517 PPM |
| IMA ADPCM |
+35.81 dB |
-40.48 dB |
+34.54 dB |
+5.444 bits |
+48.66 dB |
+0.0603 PPM |
| G.721 ADPCM |
+50.14 dB |
-56.11 dB |
+49.16 dB |
+7.873 bits |
+64.73 dB |
+0.0596 PPM |
| Rockwell ADPCM 2 |
+23.28 dB |
-27.52 dB |
+21.89 dB |
+3.344 bits |
+33.51 dB |
-0.4013 PPM |
| Rockwell ADPCM 4 |
+34.57 dB |
-41.29 dB |
+33.73 dB |
+5.310 bits |
+46.43 dB |
+0.4288 PPM |
| ZyXEL ADPCM 2 |
+22.87 dB |
-27.88 dB |
+21.68 dB |
+3.309 bits |
+33.05 dB |
-0.0089 PPM |
| ZyXEL ADPCM 3 |
+30.94 dB |
-31.23 dB |
+28.07 dB |
+4.370 bits |
+41.57 dB |
+0.2752 PPM |
| ZyXEL ADPCM 4 |
+36.39 dB |
-38.54 dB |
+34.32 dB |
+5.409 bits |
+48.56 dB |
-0.0103 PPM |
| MP3 -b 8 |
+94.94 dB |
-103.61 dB |
+94.39 dB |
+15.385 bits |
+100.85 dB |
+0.0487 PPM |
| MP3 -b 16 |
+92.96 dB |
-101.72 dB |
+92.42 dB |
+15.058 bits |
+100.87 dB |
+0.0517 PPM |
| MP3 -b 24 |
+92.61 dB |
-101.11 dB |
+92.03 dB |
+14.994 bits |
+100.81 dB |
+0.0523 PPM |
| MP3 -b 32 |
+92.59 dB |
-101.02 dB |
+92.01 dB |
+14.990 bits |
+100.82 dB |
+0.0682 PPM |
| MP3 -b 40 |
+93.51 dB |
-100.93 dB |
+92.79 dB |
+15.119 bits |
+106.78 dB |
+0.0629 PPM |
| AAC -q 10 |
+72.89 dB |
-88.79 dB |
+72.78 dB |
+11.797 bits |
+77.53 dB |
-96.633 PPM |
* |
| AAC -q 100 |
+62.75 dB |
-81.97 dB |
+62.69 dB |
+10.120 bits |
+66.57 dB |
+14.780 PPM |
* |
| AAC -q 500 |
+83.62 dB |
-90.89 dB |
+82.87 dB |
+13.472 bits |
+86.95 dB |
-2.2921 PPM |
* |
| Vorbis -q -1 |
+66.48 dB |
-95.25 dB |
+66.48 dB |
+10.749 bits |
+68.14 dB |
+1.2901 PPM |
* |
| Vorbis -b 8 |
+52.78 dB |
-84.70 dB |
+52.77 dB |
+8.473 bits |
+53.81 dB |
+0.0781 PPM |
| Vorbis -b 16 |
+50.34 dB |
-84.74 dB |
+50.33 dB |
+8.068 bits |
+51.60 dB |
-0.0642 PPM |
| Vorbis -b 24 |
+58.34 dB |
-84.67 dB |
+58.33 dB |
+9.396 bits |
+60.79 dB |
+0.1480 PPM |
| Vorbis -b 32 |
+61.15 dB |
-84.66 dB |
+61.13 dB |
+9.861 bits |
+63.07 dB |
+0.1242 PPM |
| Vorbis -b 42 |
+71.72 dB |
-84.63 dB |
+71.50 dB |
+11.584 bits |
+73.21 dB |
+0.0805 PPM |
| Speex q=0 |
+8.06 dB |
-26.33 dB |
+8.00 dB |
+1.036 bits |
+9.91 dB |
-345.52 PPM |
* |
| Speex q=1 |
+36.25 dB |
-44.72 dB |
+35.67 dB |
+5.633 bits |
+38.58 dB |
+1.3934 PPM |
* |
| Speex q=2 |
+44.18 dB |
-53.03 dB |
+43.65 dB |
+6.957 bits |
+44.44 dB |
-0.2563 PPM |
| Speex q=5 |
+30.59 dB |
-67.35 dB |
+30.58 dB |
+4.788 bits |
+30.63 dB |
+8.4314 PPM |
* |
| Speex q=9 |
+25.89 dB |
-60.08 dB |
+52.13 dB |
+8.367 bits |
+57.54 dB |
-0.0444 PPM |
| Speex q=10 |
+55.01 dB |
-62.78 dB |
+54.33 dB |
+8.732 bits |
+58.69 dB |
+0.0629 PPM |
| LPC-10 |
+29.04 dB |
-11.40 dB |
+11.33 dB |
+1.589 bits |
+14.26 dB |
+18882. PPM |
* |
| iLBC 30 ms |
+23.64 dB |
-46.50 dB |
+23.62 dB |
+3.631 bits |
+27.42 dB |
+12.037 PPM |
* |
| iLBC 20 ms |
+33.13 dB |
-45.39 dB |
+32.88 dB |
+5.169 bits |
+36.58 dB |
+0.0450 PPM |
* = large Hz errors
Hz error
The PCM 16 codec is used as the baseline of performance with it's +0.2308 PPM
Hz error. The error should of been exactly zero PPM but because of the
short duration of sample data and statistical variation an error of around
±0.5 PPM should be assumed. The Hz errors that are out of this
range are marked with a "*" symbol.
GSM 6.10, LPC-10, iLBC 30 ms, all of the AAC's, the first Vorbis, and half of
the Speex's fell out of the error zone. A 32768 point FFT was used to
investigate this frequency error further. It was found that only LPC-10
and Speex q=0 had actual frequency offset errors. The other suspect
codecs only suffered from modulation sidebands and not true frequency errors.
PCM 16 and 8
Linear PCM 16 is the 16-bit baseline reference that was the signal source for
all of the other codec tests. It's ENOB performance is almost an ideal 16
bits and PCM 8 is half of that as it should be. The distortion
measurements scale with bit quantization noise as expected. PCM 8 has
a DC offset (0 Hz) error of +35 dB that is likely caused by a bug in sox.
A-law and u-law
These companding codecs should have 78 and 84 dB of dynamic range but the SFDR
measurements do not reflect this. While the logarithmic transform
mappings do support this dynamic range claim the harmonic distortion added by
the companding noise cut these claims almost in half. Companding noise is
like quantization noise but worse. The significance of this is that
dynamic range (the ability to support high amplitude signals) is not the same
as SFDR. A-law and u-law's dynamic range might be good for voice
communications but the lower distortion measurements that result hurt the modem
channel capacity. PCM 8 has much better distortion numbers.
GSM 6.10
The distortion performance of GSM 6.10 and PCM 8 are almost equivalent which
is very impressive when the 13 kbps bandwidth is considered. The noise
floor is fairly low and the folded artifacts in the spectrogram sweep are
interesting. The amplitude of the sweep past 2000 Hz fluctuates wildly
with a delta of ±5 dB which indicates some sort of resonance in the
internal filter banks. The silence noise floor has an interesting 200 Hz
fundamental with harmonics. A square wave twiddling of the bottom bits
could generate this error and it is likely a bug in the toast encoder / decoder.
ADPCM
G.721 ADPCM has distortion measurements that are almost equal to PCM 8.
MS ADPCM comes in a close second with a 0.65 bit lower ENOB measurement.
All of the other 4-bit ADPCM's have an ENOB that is 1.8 bits lower than MS
ADPCM. The value of 1.8 bits is significant and supports the common
belief that MS ADPCM is better than IMA ADPCM. Also of interest is that
the 3 and 2 bit ADPCM's respectively have almost exactly 1 or 2 bits less of
ENOB than their 4-bit counterparts.
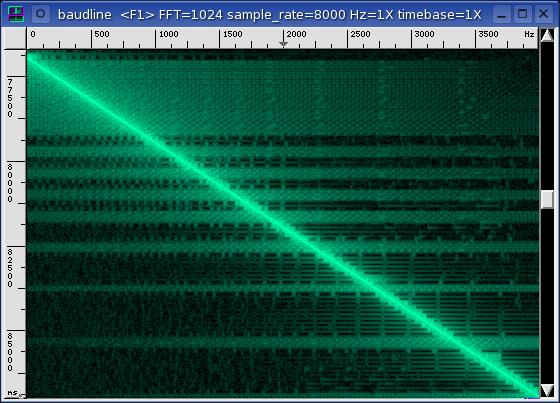
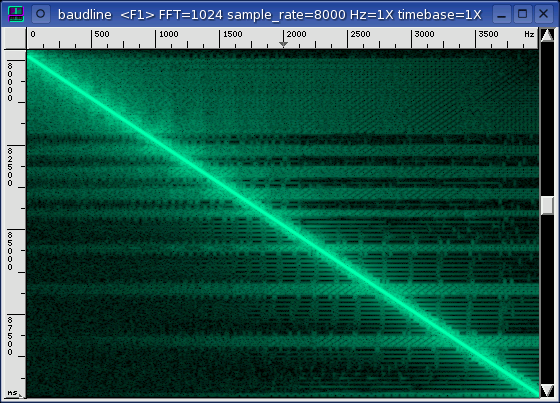
MP3
All of the MP3 bit rates from 8 to 40 kbps have an ENOB of about 15 bits.
None of the other codecs in this comparison survey come as close to the
performance of PCM 16 as MP3 does. This is very impressive, especially
for a compression codec that is considered antiquated. See the MP3
spectrogram images. The first visible trend is that as the bit rate
increases the lobe width / noise decreases which implies that more bits results
in a more accurate sweep. The second visible trend shows an interesting
side effect of more bits is that MP3 starts making subtle spectral noise floor
mistakes. This is counter intuitive.
AAC
The distortion performance of AAC is not as good as MP3 which is surprising
since AAC is the more modern codec. Increasing the bit rate by adjusting
the "-quality" setting improves the ENOB at the highest setting but hurts the
ENOB at the middle (default) setting. Looking at the spectrograms
highlight an interesting spectral block structure. There must be an
algorithm that kicks in above 1000 Hz at work because the block mode structure
changes to some periodic pulses in the noise floor. This is probably due
to algorithmic perceptual decisions that are occurring when the main frequency
is higher than 1000 Hz.
AAC at all three quality settings has significant Hz errors. The worst is
at "-q 10", the lowest setting, with almost 100 PPM of frequency error.
A 32768 point FFT was used to further investigate the Hz error and modulation
distortion sidebands were found to be the cause.
Vorbis
The Vorbis codec starts out strong with an ENOB of +10.749 bits at the "-q -1"
setting. Then the ENOB performance drops as the bit rate is increased
which is completely counter intuitive. The ENOB does finally climb up
to +11.584 bits at the highest and final "-b 42" setting but something is
wrong with sine sweep amplitude. There are -10 dB holes at 1500 and
3000 Hz. This is odd because none of the lower quality settings have
this anomaly.
The spectrogram sweeps look almost identical at all of the quality
settings. The only minor difference is a slight increase in the noise
floor texture as the bit rate increases. It is like Vorbis is using the
extra bits to incorrectly fix the noise floor and not allocating them to
improve the linear sine sweep.
The distortion performance of Vorbis is not as good as either AAC or MP3.
Vorbis also doesn't appear to scale well with bit rate. It's performance
as a function of bit rate is quirky.
Speex
The Speex q=0 setting has an ENOB of +1.036 bits and a Hz error of -345.52 PPM
which respectively are the lowest and the second worst seen in this compression
codec survey. The sine wave has strong harmonic distortion and the Hz
error is caused by modulation distortion. The spectrogram frequency sweep
is more of a hazy drifting cloud than it is an increasing sine wave.
Speex's performance improves at the higher quality levels with a fluctuating
ENOB between 5 and 9 bits. The Hz PPM error is also much lower than it
was for the q=0 case. The harmonic distortion is strong at q=1 and it
decreases with the higher quality settings. Interesting features are
present in the noise floor of the spectrogram sweep.
It almost looks like there are three completely different Speex algorithms
at work depending on the quality setting. See how the Speex spectrogram
images match these three behavior classes:
- A fuzzy drifting cloud at q=0.
- Strong crosshatch noise floor and a wildly fluctuating sine sweep
amplitude at q=1 and q=2.
- Noise floor discontinuity levels and a tighter sweep response at q 5
through 10 settings.
The differences are very interesting. No other codecs on our list have
such drastic transitions as the bit rate is changed.
LPC-10
The LPC-10 has 1.6 bits of ENOB which is extremely poor. Even 2-bit ADPCM
is significantly better. The silence noise floor is the highest of all
of the test codecs. Not sure if the noise floor is an accident because
it's frequency response closely matches that of the WGN test source.
The linear sine wave sweep spectrogram is particularly revealing. Very
strange zigzag like harmonics are visible and discrete tone banks can be
seen. The sweep stops at 2500 Hz and frequencies past that turn into
wideband noise. There also appears to be alias folding around a 2500 Hz
point. This suggests that LPC-10 is internally resampling to a 5000
sample per second rate, and doing so with very poor filters.
The Hz error of +18882 PPM is the worse seen in this survey. A 32768
point FFT was used to verify this error and the main frequency is very clean
but it is offset by almost 6 Hz! With the test signal, LPC-10 has a third
of a semitone of frequency error. This much error will clearly be audible
and it could make tonal speaker identification difficult.
The LPC-10 codec wins a prize for the craziest sounding sine wave sweep.
Actually, the sine wave sounds more like a triangle wave due to the severe
amount of distortion. The LPC-10 linear sweep begins with the sound of
an accelerating race car frantically shifting gears when all of a sudden
something goes horribly wrong - panic, chaos, impact with a brick wall at 2500
Hz, bursting into flames. This eloquent analogy sums up LPC-10's
performance perfectly.
Download the file nuke_lpc10.wav.gz to listen.
iLBC
Both 30 ms and 20 ms iLBC share many of the same spectral artifacts.
Prominent low frequency roll-off (HPF) at 140 Hz. Brief noise floor drops
and resonant noise clouds when the sine sweep hits 1550 and 2630 Hz.
Strong modulation side lobes that parallel the fundamental tone sweep by about
150 Hz.
|
|
|
|
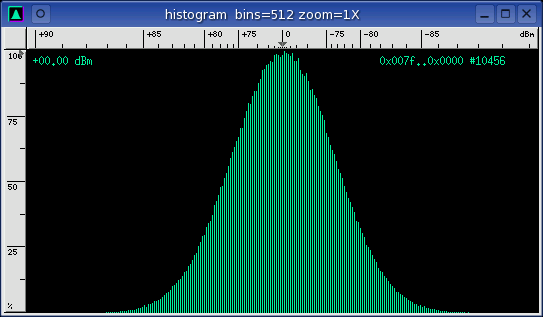
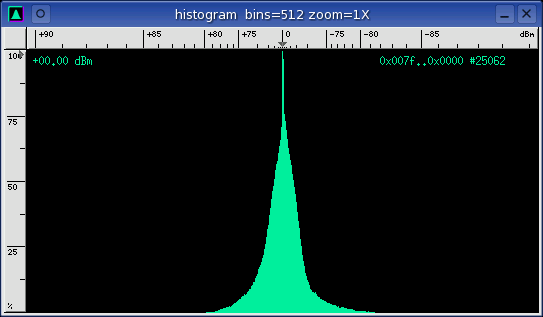
Quantization |
A white Gaussian noise (WGN) signal source was generated and encoded by the
different compression codecs. The
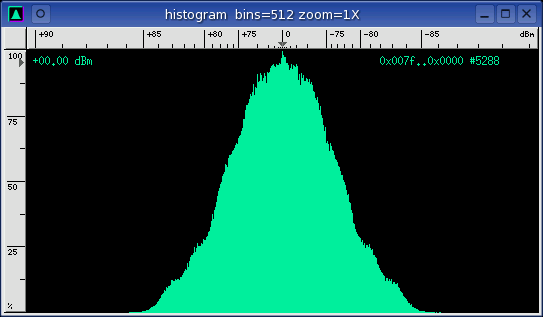
Histogram plots below
show the unique sample distributions.
PCM 16 (and most codecs)
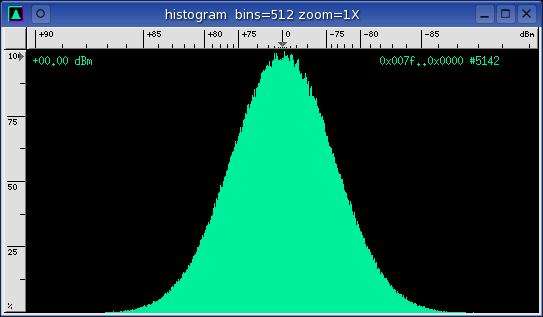
Normal Gaussian shaped histogram.
PCM 8
Requantization to 8-bits makes half of the 512 bins empty.
A-law
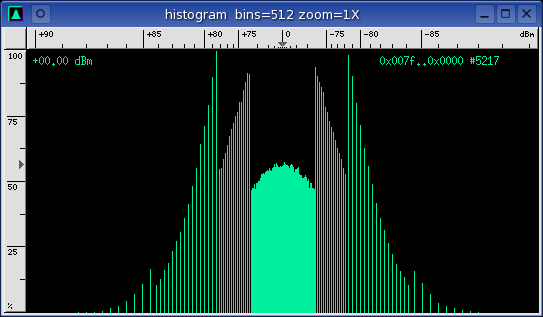
Different log companding levels. Zooming in shows even more detail.
u-law
Different log companding levels. Very similar to A-law.
GSM 6.10
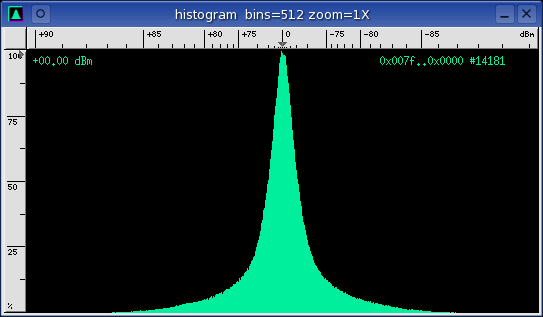
Slender exponential.
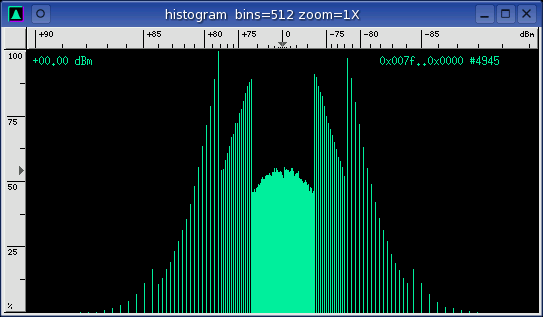
MS ADPCM (16X)
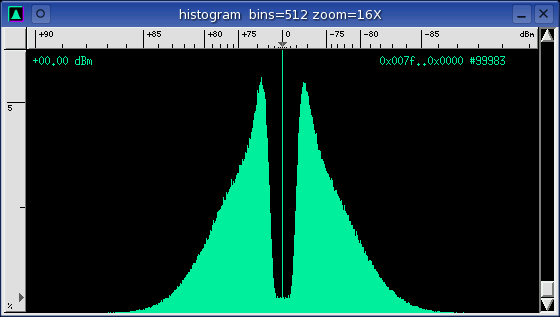
Split center with strong bin zero (silence) spike. Note the 16X zoom
factor.
G.721 ADPCM 4-bit
Lumpy.
Rockwell ADPCM 2-bit
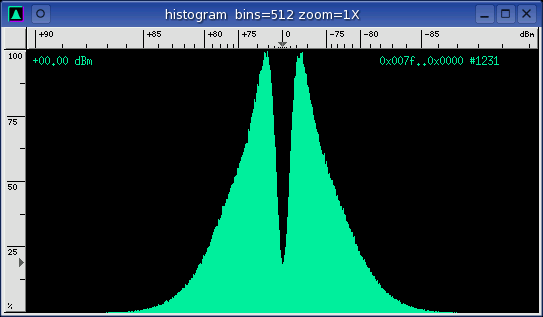
Split center.
Speex q=0
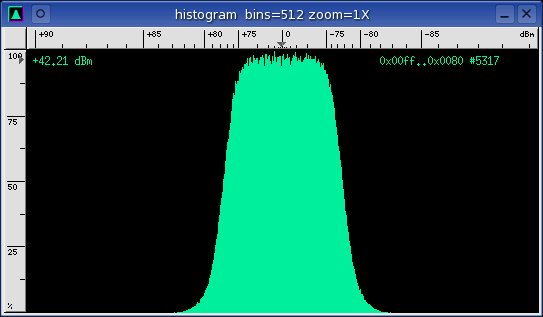
Flat top.
Speex q=1
Slender exponential with strong bin zero (silence) spike.
Speex q=2
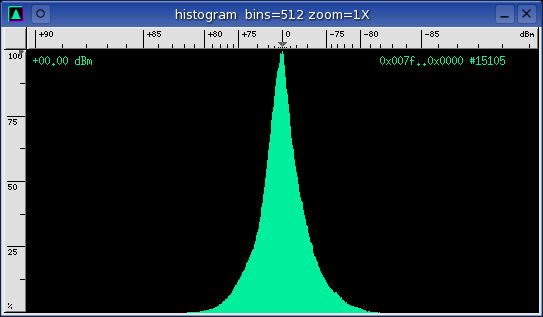
Slender exponential. Similar to GSM 6.10 codec.
|
|
|
|
Analysis |
Visually comparing the spectrogram sine sweeps and the average window filter
responses for the different audio devices reveals many interesting
details.
formula
- density = bit_rate / sample_rate [units are bits/sample]
- efficiency = ENOB / density [units are samples]
The efficiency calculation is an interesting measure of the coding
quality. Efficiency can be thought of as how many bits of ENOB
performance does each coded bit generate. The efficiency calculation
results in a bit-for-bit measure where the bits cancel and the units are
"samples." Higher values are better.
| codec |
bit rate |
density |
ENOB |
efficiency |
| PCM 16 |
128 kbps |
16 bits/sample |
+15.657 bits |
0.979 |
| PCM 8 |
64 kbps |
8 |
+8.011 bits |
1.001 |
| A-law |
64 kbps |
8 |
+6.216 bits |
0.777 |
| u-law |
64 kbps |
8 |
+6.139 bits |
0.767 |
| GSM 6.10 |
13 kbps |
1.625 |
+7.944 bits |
4.889 |
| MS ADPCM |
32 kbps |
4 |
+7.227 bits |
1.807 |
| IMA ADPCM |
32 kbps |
4 |
+5.444 bits |
1.361 |
| G.721 ADPCM |
32 kbps |
4 |
+7.873 bits |
1.968 |
| Rockwell ADPCM 2 |
16 kbps |
2 |
+3.344 bits |
1.672 |
| Rockwell ADPCM 4 |
32 kbps |
4 |
+5.310 bits |
1.328 |
| ZyXEL ADPCM 2 |
16 kbps |
2 |
+3.309 bits |
1.654 |
| ZyXEL ADPCM 3 |
24 kbps |
3 |
+4.370 bits |
1.457 |
| ZyXEL ADPCM 4 |
32 kbps |
4 |
+5.409 bits |
1.352 |
| MP3 -b 8 |
8 kbps |
1 |
+15.385 bits |
15.38 |
* |
| MP3 -b 16 |
16 kbps |
2 |
+15.058 bits |
7.529 |
| MP3 -b 24 |
24 kbps |
3 |
+14.994 bits |
4.998 |
| MP3 -b 32 |
32 kbps |
4 |
+14.990 bits |
3.748 |
| MP3 -b 40 |
40 kbps |
5 |
+15.119 bits |
3.024 |
| AAC -q 10 |
5.744 kbps |
0.718 |
+11.797 bits |
16.43 |
* |
| AAC -q 100 |
8.985 kbps |
1.123 |
+10.120 bits |
9.012 |
| AAC -q 500 |
18.94 kbps |
2.368 |
+13.472 bits |
5.689 |
| Vorbis -q -1 |
4.312 kbps |
0.539 |
+10.749 bits |
19.94 |
* |
| Vorbis -b 8 |
5.287 kbps |
0.661 |
+8.473 bits |
12.82 |
* |
| Vorbis -b 16 |
5.974 kbps |
0.747 |
+8.068 bits |
10.80 |
* |
| Vorbis -b 24 |
7.590 kbps |
0.949 |
+9.396 bits |
9.901 |
| Vorbis -b 32 |
9.951 kbps |
1.244 |
+9.861 bits |
7.927 |
| Vorbis -b 42 |
15.49 kbps |
1.936 |
+11.584 bits |
5.984 |
| Speex q=0 |
2.240 kbps |
0.280 |
+1.036 bits |
3.700 |
| Speex q=1 |
4.051 kbps |
0.506 |
+5.633 bits |
11.13 |
* |
| Speex q=2 |
6.065 kbps |
0.758 |
+6.957 bits |
9.178 |
| Speex q=5 |
11.22 kbps |
1.402 |
+4.788 bits |
3.415 |
| Speex q=9 |
18.47 kbps |
2.309 |
+8.367 bits |
3.624 |
| Speex q=10 |
24.95 kbps |
3.119 |
+8.732 bits |
2.800 |
| LPC-10 |
2.488 kbps |
0.311 |
+1.589 bits |
5.109 |
| iLBC 30 ms |
13.33 kbps |
1.666 |
+3.631 bits |
2.179 |
| iLBC 20 ms |
15.20 kbps |
1.900 |
+5.169 bits |
2.721 |
| gzip |
126.0 kbps |
15.75 |
+15.657 bits |
0.994 |
| bzip2 |
66.95 kbps |
8.369 |
+15.657 bits |
1.871 |
| flac |
67.69 kbps |
8.461 |
+15.657 bits |
1.850 |
* = highly efficient codecs
ADPCM
The ADPCM codecs ranged in quality from 1.33 to 1.97 with G.721 being the
leader. Of the two ADPCM codecs that operated at multiple rates the
2-bit version was slightly more efficient. On the other hand the ENOB
drops by one bit when the rate is reduced by one bit so the ADPCM algorithm
scales.
From a histogram point of view MS ADPCM, G.721 ADPCM, and Rockwell 2-bit ADPCM
all had quantization deformities. It is strange that these quantization
errors did not translate into lower ENOB distortion measurements. It is
also odd that these three codecs had the highest ADPCM efficiencies.
Theoretically, quantization errors are a cause of THD and lower SNR.
Maybe there is a universal trade-off explanation for this quantization / ENOB
efficiency correlation?
lossless
Of the lossless codecs; bzip2 and flac had almost a factor of 2 compression
ratio while gzip had almost no effect. The sine wave's 301.99 Hz
frequency made the samples very unique and non-repetitive so it is surprising
that bzip2, a generic entropy compressor, slightly out performed the highly
specialized audio compressor flac.
efficiency(bit_rate)
With ADPCM, MP3, AAC, and Vorbis the bit efficiency decreases as the bit rate
increases. The trend is also true for Speex if the q=0 entry is
ignored. This observation implies that compressing a sine wave is more
efficient at the lower bit rates which means that the efficiency isn't a
constant and it doesn't scale as a function of bit rate. In fact it has
the inverse relationship and is completely counter intuitive.
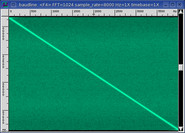
bandwidth vs. ENOB
Plotting the compression codec's bandwidth versus it's ENOB measurement is an
interesting way to visualize efficiency. Instead of condensing efficiency
down to a single numeric value, this method provides a spatial
representation. See the bandwidth vs. ENOB plot below:
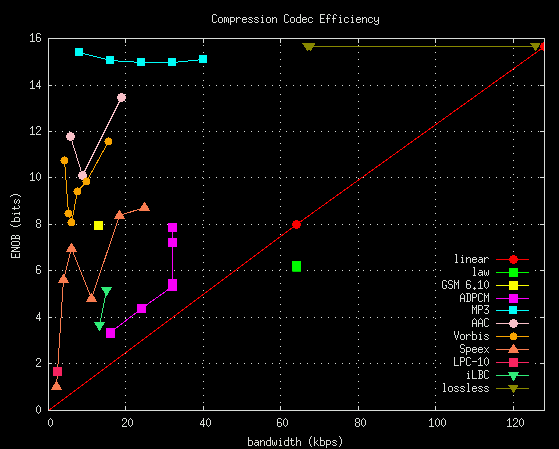
The diagonal red line cutting the graph in half is the baseline level of
performance. It represents the uncompressed linear PCM 8 and 16 data
points and the extrapolation to zero. The further a codec is above the
red line, the more efficient it is. Also, the closer a codec's position is
towards the upper left corner limit (zero kbps bandwidth with 16 bits ENOB), the
more "perfect" it is.
Many useful insights and new questions can be extracted from this plot.
Such as:
- A-law and u-law are the only codecs below the red baseline.
- The 2, 3, and 4 bit Rockwell and ZyXEL ADPCM codecs form a straight line
that is parallel to the red baseline.
- The 4-bit G.721 and MS ADPCM codecs are not like the other ADPCM
codecs. What if 1, 2, and 3 bit ADPCM versions of those codecs were
possible?
- How can the "V" shaped dip at the middle bandwidths of the AAC, Vorbis,
and Speex codecs be explained?
- GSM 6.10 looks like it should be a data point for Speex.
- LPC-10 at 2.5 kbps is on the Speex curve. It also looks like the
parallel 2, 3, and 4 bit ADPCM line if extrapolated down to 0.3 bits would
intersect with the LPC-10 data point.
- MP3 has a dominate position closest to the top left corner.
- It looks like the music codecs perform better than the voice codecs for
this particular sine wave test.
|
|
|
|
Conclusion |
Most of the compression codecs used in this comparison survey are perceptual
coders that were designed for voice or music applications. They were not
designed for the encoding of sine wave test signals. This is why audio
compression comparisons are typically done with user listening tests. The
problem with listening tests is that they are subjective and biased. Our
goal with this SigBlips comparison was to look at the problem from a different
perspective, conduct a fair test, and learn something about the inner workings
of each codec. To that end we feel this test was a success and here is
our conclusion:
Exceptional algorithmic compression performance was seen in the codecs that
had an efficiency greater than 10. These codecs were MP3 -b 8, AAC
-q 10, Vorbis -q -1, Vorbis -b 8, and Speex q=1. Of this group only Speex
q=1 had an unusually shaped histogram, the other codecs had normal Gaussian
shaped histograms. Vorbis and MP3 had frequency sweeps with the
cleanest looking spectrograms. Unfortunately Vorbis had a severe clipping
problem with maximum amplitude (0 dB) signals. Also MP3 had an ENOB of
15 bits compared to Vorbis' 10 bits.
MP3 at 8 kbps (-b 8) is bit-for-bit the clear winner as the most efficient
coder in this audio compression codec survey. The MP3 encoder Lame is
the reason for this high level of performance. The iTunes and the blade
MP3 encoders were also evaluated but they were not included in this codec
compression survey because of their poor performance.
|
|
|
|
|