We've got signal, but what the heck is it?
That's your mission. Analyze this bébé.
 download the audio file 13.wav.gz
hints :
-
No need to gunzip this file since baudline can automatically uncompress files.
-
Setup baudline to be a Web Browser helper application as described in the
FAQ.
-
Try playing the mystery signal at a slower quarter (0.25X) or half (0.5X)
speed.
-
Use the
Color Aperture
window to focus and maximize the color resolution to the -10 dB to -60 dB
range. Changing the RGB curve shapes in the
Color Picker window
might also be helpful.
- Explore the signal with the
Histogram and
Waveform windows at different
zoom levels. Are there any interesting and unique characteristics?
-
This is a 3 channel .wav audio file. To listen to the 3rd channel or if
you have multiple sound cards and are experiencing play back problems then
open up the Output Devices
window and adjust the channel enabling / mapping controls.
What is it?
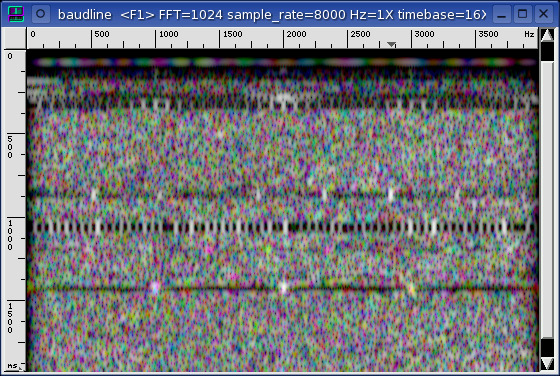
It is the baudline visualization tool looking at itself. The above image
is a baudline spectrogram of the baudline x86 executable code. The
Raw Parameters window was
used to open the baudline x86 binary as a strided 3 channel signal file.
Equivalently this can also be accomplished using baudline's
standard input option with the
following command:
- cat baudline | baudline -stdin -channels 3
code and data
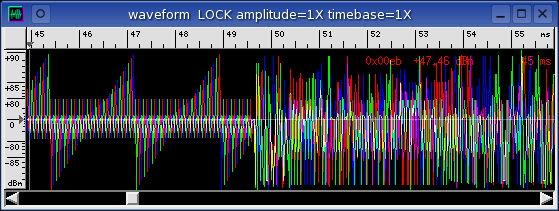
This mystery signal looks and sounds a lot like a negotiating modem with the
familiar tone and noise bursts. The tones are periodicities in the x86
binary created by repeated code blocks or internal data tables (see the
waveform above). The noise bursts are sections of executable x86 code
that are fairly random in byte structure and haven't been unrolled. So
the baudline code and data segments are responsible for this interesting
and strange looking spectrogram.
 periodicity
There are a number of insightful periodicities in this mystery signal and they
can be measured with baudline's
Periodicity measurement
window. Setting the fundamental rule option to "mouse exact" or
"mouse climb" with allow the periodicity value to track the mouse cursor
position. The periodicities of 4, 8, 31.0303, 89, and 137 can be all be
seen.
stride by 3
A channel stride of 3 does a number of interesting things:
- From a DSP perspective it is like decimating without filtering which
causes aliasing.
- It scrambles / chops up the data by a factor 3 which is the first prime
number that is not a power of 2. This can reveal new relationships that
should not be inherent in the data.
- It generates 3 channels for a colorful
RGB overlay display where spectral
color denotes base 3 origin.
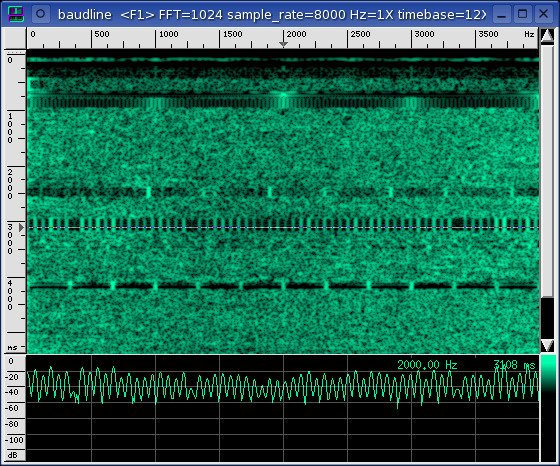
For comparison see the stride by 1 spectrogram image below. It
looks very similar to the initial stride by 3 image. Many features are
the same and some have changed slightly.
Experimenting further with the Raw Parameter's Decode Format option
will result in many new relationships with some of them being quite
unexpected. The 1 bit binary (msb and lsb), 8 bit linear (signed and
unsigned), and 16 bit linear (big endian) are decode options all worth
exploring.
|