|
|
|
color picker |
|
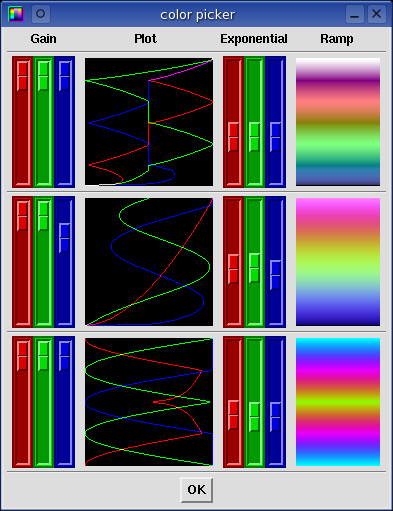
 The color picker window has the controls for three user custom color
ramps (top to bottom) that can be used in the spectrogram display. By
modifying a series of RGB (red, green, blue)
sliders a custom spectrogram color ramp can be created. In order to
display the custom color ramp they first need to be enabled in the input
channel mapping window.
The color picker window has the controls for three user custom color
ramps (top to bottom) that can be used in the spectrogram display. By
modifying a series of RGB (red, green, blue)
sliders a custom spectrogram color ramp can be created. In order to
display the custom color ramp they first need to be enabled in the input
channel mapping window.
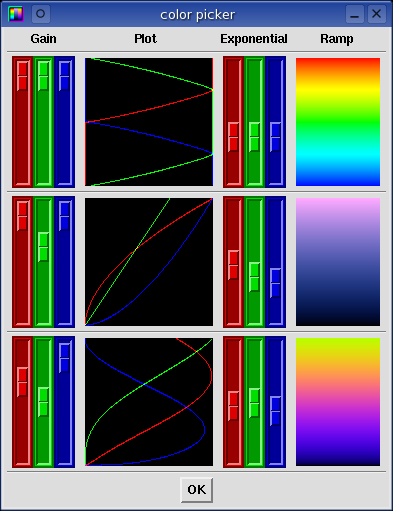
The first set of RGB sliders control the color Gain. The second
set of RGB sliders control the color Exponential curve. Both
the gain and the exponential curve parameters are plotted in the black box
entitled Plot. On the far right is the color Ramp which
maps spectral dB energies in to spectrogram color intensities. The
uppermost color represents a 0 dB value in the spectrum window, while the
lowermost color represents -136 dB.
palette menus
These menus offer control parameters for the further modification of color
space. Various palette functions and shapes can be selected in many
unique combinations that result in vibrant and exciting color palette
ramps. To access the palette menus, point the mouse in the Plot
or Ramp graphics regions then press and hold the 3rd mouse
button. Each of the three user custom color ramps has its own separate
settings. Some of the palette controls can be cycled through with the
Up/Down arrow keys or a scroll wheel mouse.
 palette functions
Many functions are available that allow for the rotation, folding, or scaling
or the color space. The functions are fairly self explanatory. The
Gain and Exponential sliders can be reset to their default
values. The gain can be doubled for more dynamic range or for clipping
effects. A fade to black function performs a graceful decent
towards darkness at the -136 dB bottom of the spectrum zone.
 RGB mapping
The map RGB to menu allows for color rotation cycling. The RGB
curves can be mapped to permutations of RGB (red green blue), CMY (cyan magenta
yellow), and mono color spaces. These mappings are a form of color
rotation. New and interesting color permutations can be auditioned with
the Up/Down arrow keys or with the mouse scroll wheel.
 palette shapes
A color palette shape is an expression of the RGB color triplets vs. the signal
intensity. It defines the fundamentals of the color palette. Shapes
can range from simple linear lines, parallelograms, circle parts, cosine
functions, and zigzag divisions that create a rainbow like palette. The
custom user loadable palettes are also available in this menu. New and
interesting color palette shapes can be auditioned with the Up/Down arrow keys
or with the mouse scroll wheel.
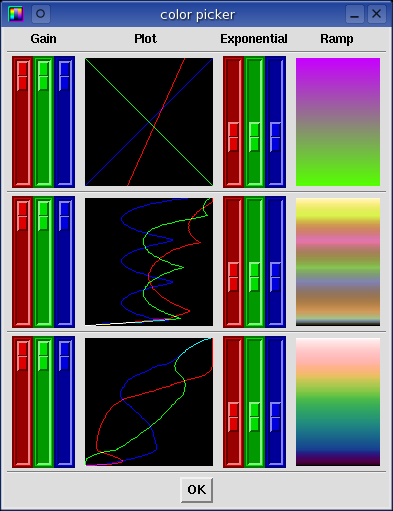
An incredible number of color combinations are possible simply by adjusting the
controls of this window. The quickest and easiest way to explore color
space is by spinning the mouse scroll wheel in the different active regions of
the color picker window. Each setting has a cascading effect and makes
the parameter space very dense. The following palettes were created by
a couple spins of the mouse wheel.
custom user loadable color palettes
This feature allows for an infinite flexibility in the generation of unique
color palettes. Create a text file that consists of at least 2 lines of
RGB numeric values and copy it into the ~/.baudline/palettes/ directory or
manually load it with the -palette command line option. The new color
palette will now be available in the palette shapes menu.
Custom user loadable color palettes can be created by hand editing a text file,
with a spreadsheet, or by a simple bit of code. For maximum resolution
with 24bpp graphics a good file format creation guideline to follow is to have
256 lines that have 3 columns of numeric RGB values that range from 0 - 255
but this is not required. The number of RGB lines can range from 2 to
3000. The RGB values can be any decimal integer or floating point
number. The palette loading algorithm is self scaling in that palette
files can be very free form. Lines can be added or deleted and files can
be concatenated onto each other. Pound # comments lines are also
allowed. Baudline's user palette feature was designed to be flexible and
robust enough that it can read palette files that have even been created for
other visualization programs.
The following picture is an example of some of the palettes included in the
baudline.tar.gz package. The first purple-green blend palette is made by
a file that consists of only these two lines:
3 9 0
7 0 9
|
|
|
|
color aperture |
 The color aperture window controls the light intensity mapping of the
color ramp. Unlike the color picker
window which only controls the parameters of the three user custom color
ramps, the color aperture window controls the intensity mapping of
all spectrogram colors displayed. By adjusting the Upper and
Lower dB sliders, the range of unique color elements that are used in
the spectrogram color ramp can be fine tuned accordingly.
The color aperture window controls the light intensity mapping of the
color ramp. Unlike the color picker
window which only controls the parameters of the three user custom color
ramps, the color aperture window controls the intensity mapping of
all spectrogram colors displayed. By adjusting the Upper and
Lower dB sliders, the range of unique color elements that are used in
the spectrogram color ramp can be fine tuned accordingly.
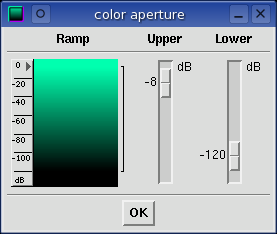
The effect of focusing the available colors to a smaller region is useful
for two reasons. First, it allows zooming the spectrogram color
sensitivity to any specific region, high or low, large or small.
The idea is to see only the section of spectral energy of interest.
Second, since the number of unique colors is finite, focusing the color ramp
intensities to a range smaller than the default 136 dB span greatly increases
the color resolution (more unique colors per dB).
This is very handy for viewing the small details of weak signals or reducing
the gradient granularity of highly averaged signals (see
drift integrator).
|
|
|
|
scroll control |
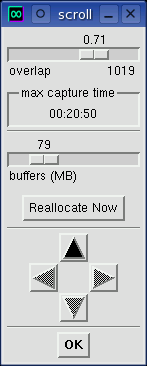
 This window controls all aspects of scrolling from speed to memory usage to
direction. Baudline uses an infinite wrap-around buffer construct that
can record and collect data forever. Both the overlap and the
buffers (MB) control sliders have a direct effect on the
max capture time which can be set to utilize all available RAM.
This can be useful for long term monitoring applications where the ability to
go back and analyze previously collected sample data is important.
This window controls all aspects of scrolling from speed to memory usage to
direction. Baudline uses an infinite wrap-around buffer construct that
can record and collect data forever. Both the overlap and the
buffers (MB) control sliders have a direct effect on the
max capture time which can be set to utilize all available RAM.
This can be useful for long term monitoring applications where the ability to
go back and analyze previously collected sample data is important.
 overlap
The overlap slider at the top controls the spectrogram scrolling speed.
Adjusting the overlap slider also has the effect of controlling resolution in
the time axis. The units are an odd "sqrt(%)" which means that the slider
value is the square root of the percent of the FFT window that slides by every
slice. That is to say, that moving the slider to the left makes the
window overlap smaller, hence allows it to scroll more quickly, while moving
the slider to the right makes baudline scroll more slowly. The range of
the sliding overlap is from just 1 sample up to the number of samples that are
in the FFT transform size. The justification for the odd square root
units is to make the control non-linear, in order to make the slider more
responsive to small changes. The overlap slider offers a course level
of control.
The number to the right and just below the slider widget (1019 in the example
image) is the actual slide size in units of samples. In addition to
displaying the slide size value this number also offers a fine level of
control. Point the mouse cursor on the number and then press the Up/Down
arrow keys or spin the mouse wheel to adjust by ±1 sample. Holding
down the Alt key while performing the increment action will change the slide
size by ±16 samples. This precise tuning capability is
extremely advantageous when aligning the line width of the
Raster transforms.
max capture time
This is the maximum amount of time in hours, minutes, seconds (HH:MM:SS) that
the circular wrap around buffer can hold, without wrapping and rewriting the
data first recorded. Many things affect this value: the overlap
percentage, the amount of buffer space, the number of channels, the color bit
depth of the graphics plane, ...
buffers (MB)
This slider represents how much system memory, in megabytes, baudline is
allowed to use for its internal buffers. Memory is important because it
determines how deep the circular buffer is while you are recording. It
also determines how much detail baudline can remember for files that are
loaded. This improves scrolling snappiness because the more data that is
precalculated, the less data needs to be calculated real-time.
Note that this value is only a request; if you load a 100 megabyte file and the
memory buffer value is set to only 20 megabytes, then baudline will use all of
the memory needed to load the file into memory (100 MB), plus the minimum
required for its graphical buffers. If you use more memory than
is available then swapping will slow down system performance.
direction
Only the scroll up direction is currently implemented.
|
|
|
|
|