|
|
|
Information |
Sound Blaster Live!
| vendor |
Creative Labs
|
| product |
Sound Blaster Live! (value), SB Live |
| interface |
PCI |
| duplex |
full |
| channels |
2 |
| resolution |
16 bits |
| max rate |
48 Ksample/sec |
| chipset |
EMU10K1 rev 8 |
| codec |
SigmaTel STAC9721,23
|
| operating system |
Fedora core3 Linux x86 2.6.11-1 |
driver |
emu10k1 ALSA 1.0.9rc2 |
buffer size |
input 2 KB, output 32 KB |
| test date |
Aug 28 2005 |
| notes |
Setting up the mixer controls is very tricky. With an external mixer
program, set the second Wave and the first AC97 slider pairs to maximum in
order to get enough gain. Mute Tone toggle for a flat frequency
response.
The emu10k1 chip crashes often when adjusting mixer settings. The
spectrum goes crazy when this happens. Fortunately doing a pause/record
cycle in baudline resets the chip.
The emu10k1 driver only has 2 input fragments so
xrun induced wideband
spectral glitches are a common occurrence. Setting -fragsize 12
helps the xrun problem but it makes the video frame rate slower.
The 4000, 8000, and 11025 Sample rates popup a "/dev/audio requested fragsize
ignored" error message. Set -fragsize 8 to get those rates
to function correctly. Unfortunately the larger fragment size will also
make the frame rate slower. The 5510 sample rate won't work with the SB
Live no matter how the fragsize is set.
Set the Tone Generator's digital gain to -4 or -5 dB for 0.2 bits more of ENOB.
|
The EMU10K1 chip uses an internal 48000 sample rate for all data paths.
The native rate is 48000 and the EMU10K1 DSP does sample rate conversion.
Many users complained loudly about this "feature" when the SB Live! card was
first released. Does this hurt or help the distortion measurements?
Let's see.
This card is part of the Full Duplex DAQ comparison
survey.
|
|
|
|
Sample Rate |
The sample rate on DAQ cards is not a fixed absolute constant. Like time,
it fluctuates, and it is difficult to measure accurately. Sometimes there
are relationships between the input and output sample rates that can reveal
interesting details about the inner working machinery.
The following table of measurements use a technique described in the
sample rate stability application
note. The rate column is the sample rate value that the collection
hardware is programmed to. The in/out rate and in/out error
columns are absolute measurements of the ADC / DAC clock. The
loop error column uses a tone generator loopback method for a high
accuracy measurement of the relative difference between the ADC and the DAC
clocks. The three error
PPM columns are theoretically
related by the formula: "in_error - out_error = loop_error"
| rate |
in rate |
out rate |
in error |
out error |
loop error |
| 4000 |
4000.438 |
3999.482 |
+109.500 PPM |
-129.500 PPM |
+244.198 PPM |
| 5510 |
|
|
|
|
|
| 8000 |
7998.217 |
8000.867 |
-222.875 PPM |
+108.375 PPM |
-122.054 PPM |
| 11025 |
11026.18 |
11025.67 |
+107.029 PPM |
+60.7710 PPM |
+53.1485 PPM |
| 12000 |
11997.35 |
12001.39 |
-220.833 PPM |
+115.833 PPM |
+0.0000 PPM |
| 16000 |
16001.85 |
16000.86 |
+115.625 PPM |
+53.7500 PPM |
+61.0381 PPM |
| 22050 |
22043.61 |
22051.33 |
-289.796 PPM |
+60.3175 PPM |
+53.1485 PPM |
| 24000 |
24002.28 |
24002.55 |
+95.0000 PPM |
+106.250 PPM |
+0.0000 PPM |
| 32000 |
31995.93 |
32004.49 |
-127.188 PPM |
+140.312 PPM |
-30.5175 PPM |
| 44100 |
44104.95 |
44105.51 |
+112.245 PPM |
+124.943 PPM |
-13.2850 PPM |
| 48000 |
48001.67 |
48005.20 |
+34.7917 PPM |
+108.333 PPM |
+0.0000 PPM |
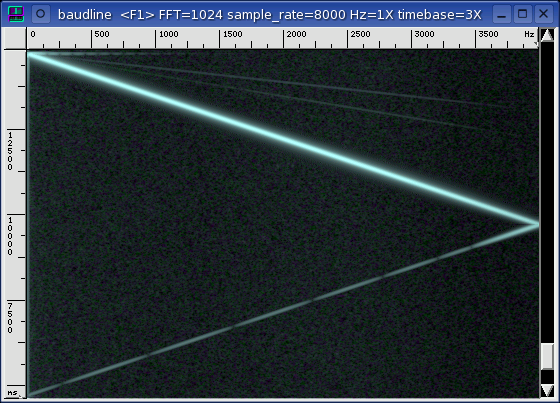
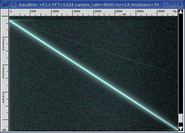
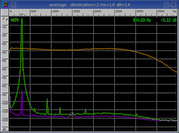
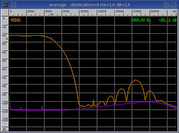
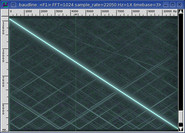
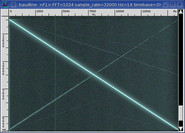
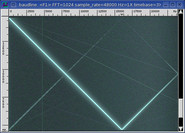
The non zero PPM difference of the in error and out error
columns raised some suspicions. For further investigation the -debugrate
command line option was used to create the plot shown below.
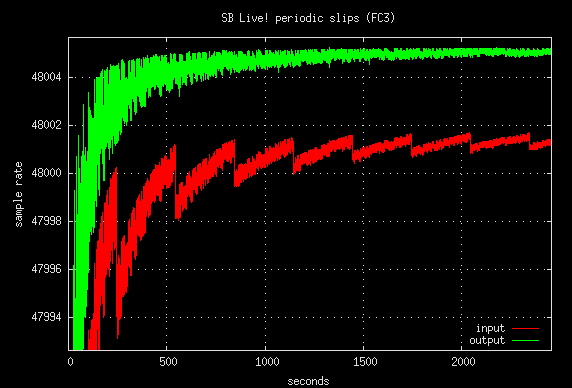
This plot depicts a periodic fragment slip.
The output channel is converging nicely to a 48005.20 sample rate. The
input channel is experiencing a fragment slip every 300 seconds. The
sample rate is converging to 48001.67 with this this zigzag motion.
This is a 73.5413 PPM difference.
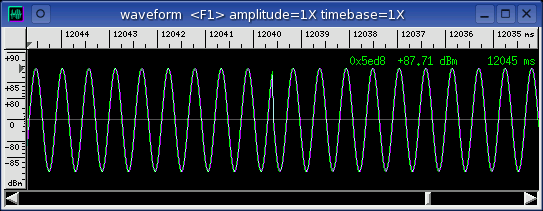
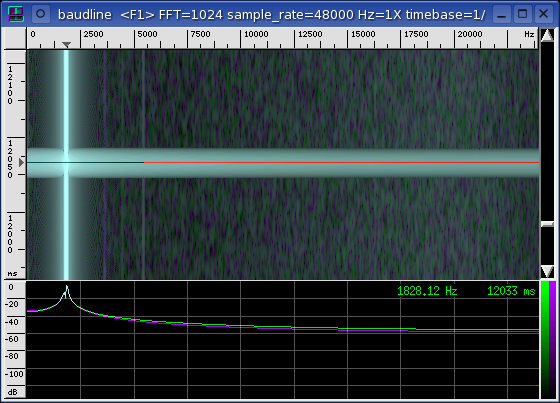
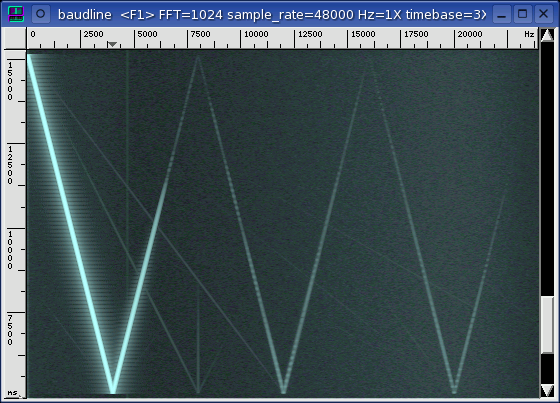
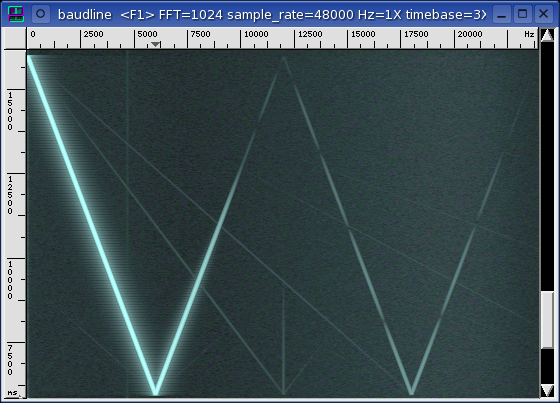
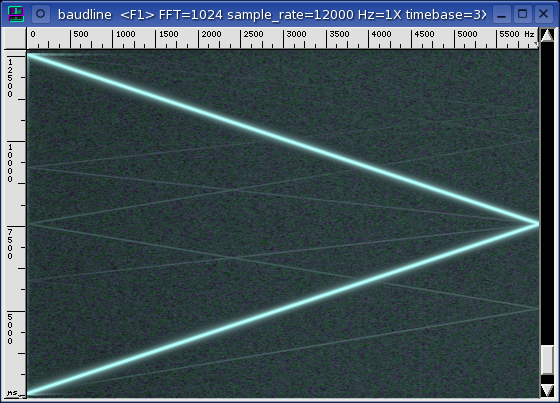
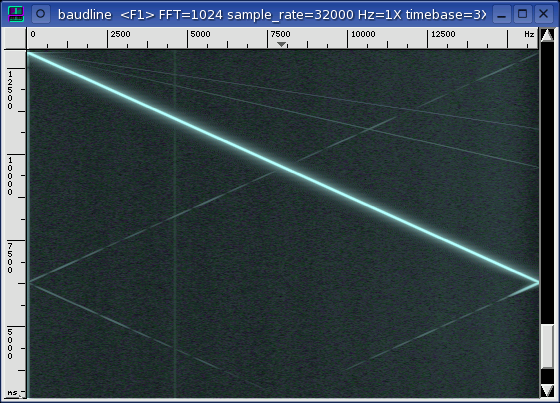
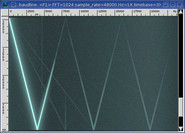
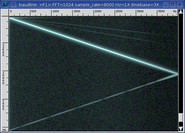
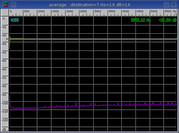
The baudline spectro and waveform windows below show the wideband glitch that
occurs every 300 seconds.
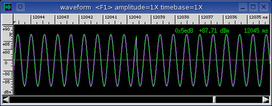
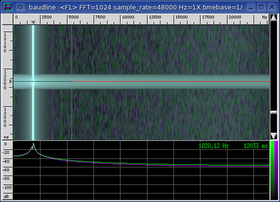
The periodic fragment slip is causing a discontinuity in the time domain.
This is typical of what happens when an xrun is encountered. What is
interesting is that an xrun is not reported because the SB Live! continues
operating as if nothing unusual just happened. Only having 2 input
fragments could be enhancing this problem.
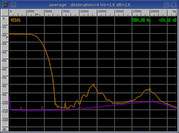
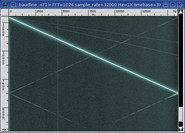
Below is the -debugrate plot from Knoppix 2.4.27 OSS 3.8.2. The hardware
is the same but the Linux distribution, kernel version, and audio driver are
all different. The standard amount of audio fragments are available,
all 128KB of buffer space is being used, and the -fragsize option was not
required.
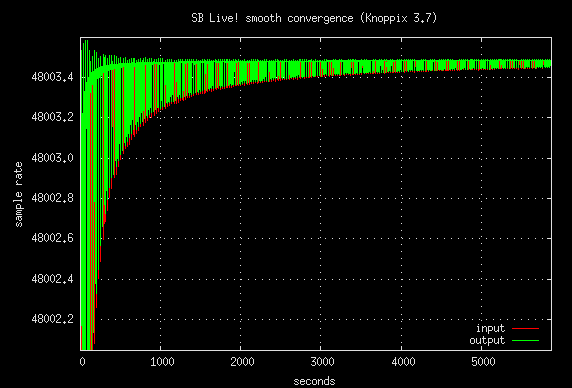
The Knoppix plot has a smooth sample rate convergence and is an indication that
the OSS audio driver is handling the fragment interrupts correctly. Three
major components have changed between Knoppix OSS and Fedora core3 ALSA which
makes it difficult to determine the exact source of the fault. The number
of input fragments is decided by the audio driver so ALSA is the prime
suspect. The important points are:
- The Linux SB Live! driver previously worked correctly but now it is broken.
- Something strange is happening with Fedora core3's input sample rate
estimate and it cannot be trusted.
- Further testing is needed to determine the exact cause of this error.
|
|
|
|
Frequency Domain
|
The sound card's input and output jacks are connected with a short external
cable and run in full duplex mode. This is a loopback test and baudline's
tone generator is the signal source. Distortion, noise floor, filter
response, and inter channel crosstalk are the frequency domain measurements of
interest in this section.
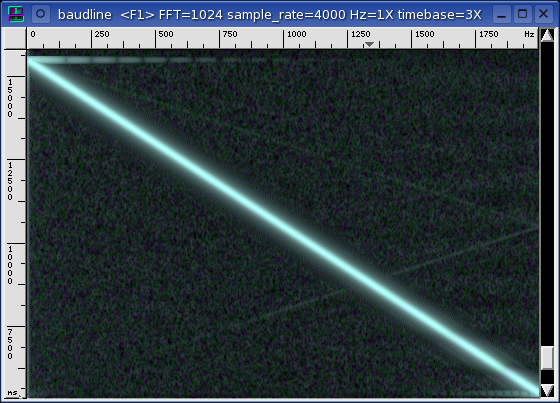
The signal test sources are a pure sine wave, a linear sine sweep, and
WGN. The sine wave is
used for the distortions and crosstalk measurements. The linear sine
sweep and WGN are used for the filter characterization measurement.
Both are an application of the
swept sine vs. WGN technique
and are equivalent measures of the frequency response.
Since spectral performance is a function of sample rate, each of the sound
card's native rates will be tested. The highest sample rate is usually
the cleanest and this is advantageous because it allows the isolated testing
of the ADC and the
DAC. The matched,
source, and sink sample rate combinations are described below.
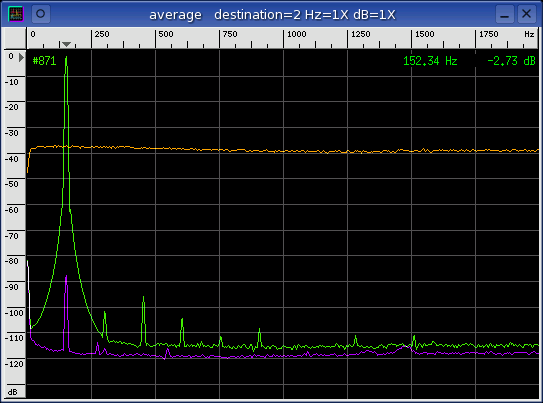
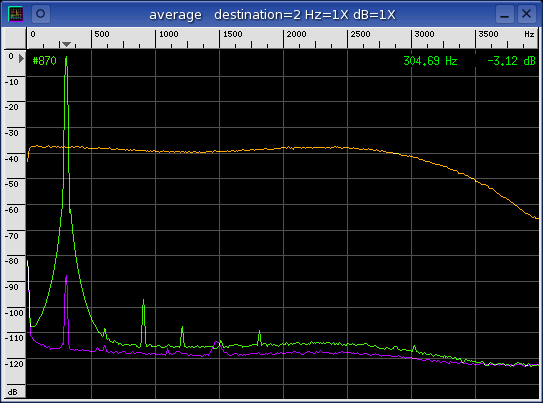
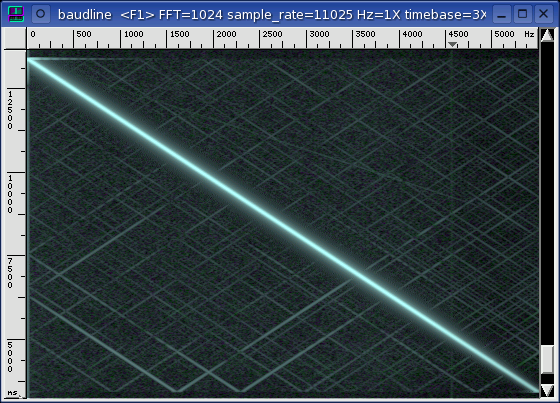
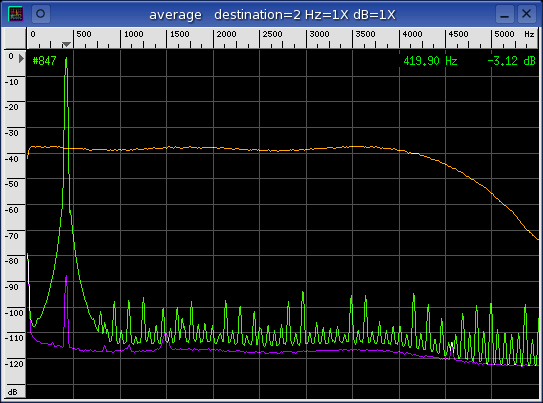
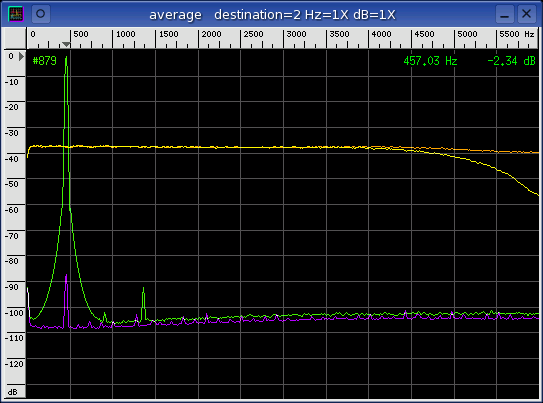
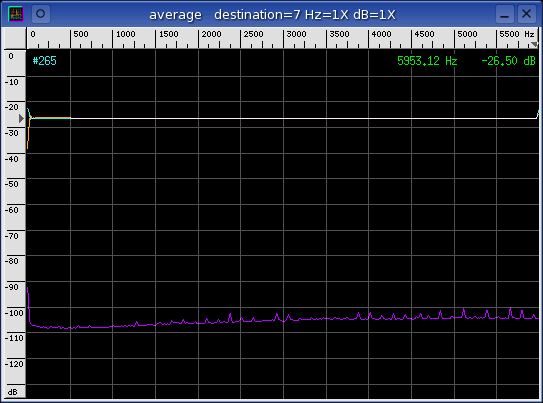
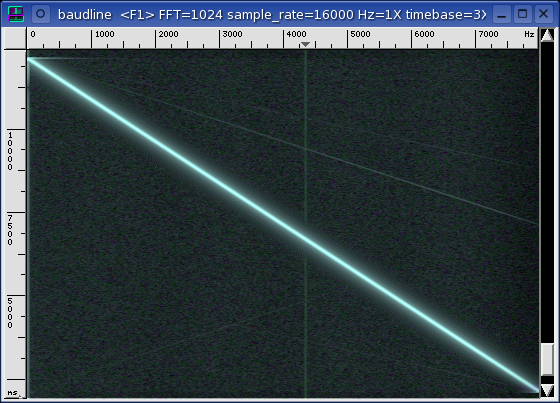
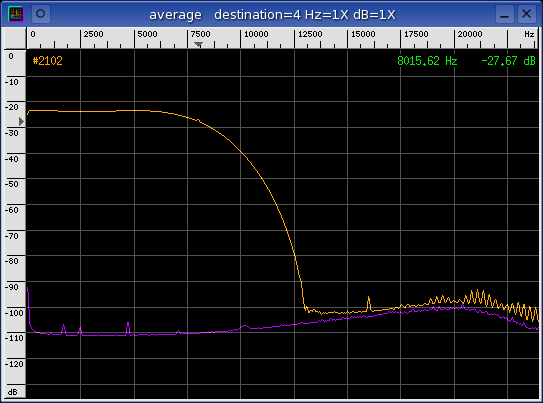
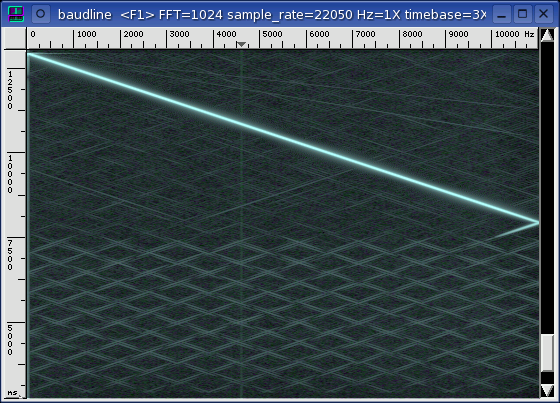
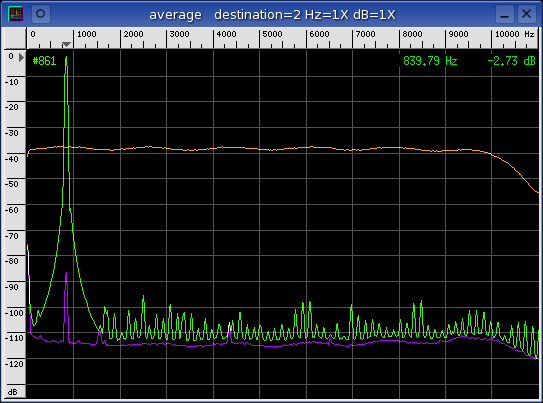
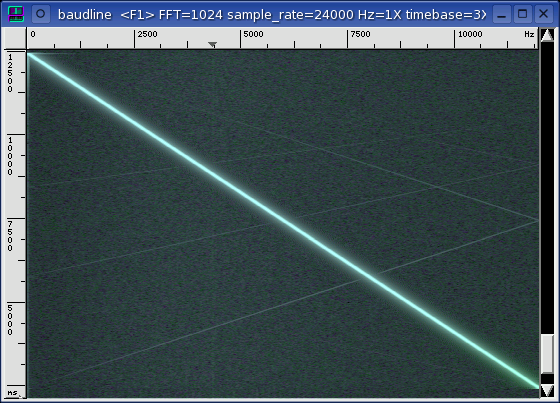
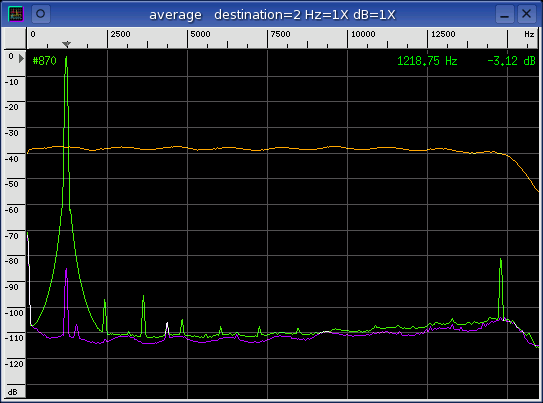
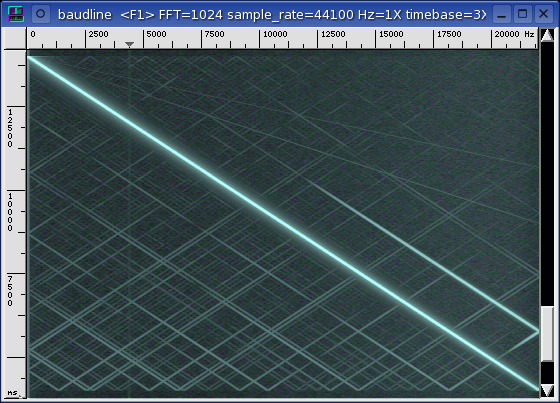
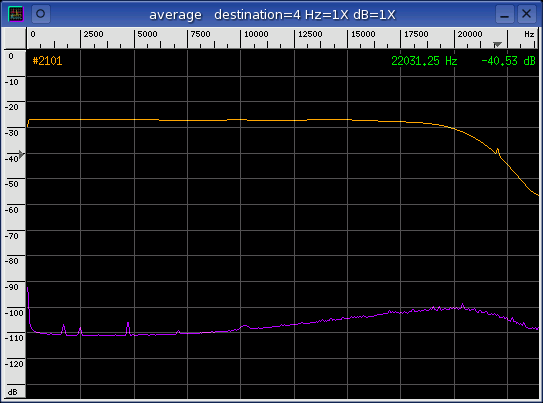
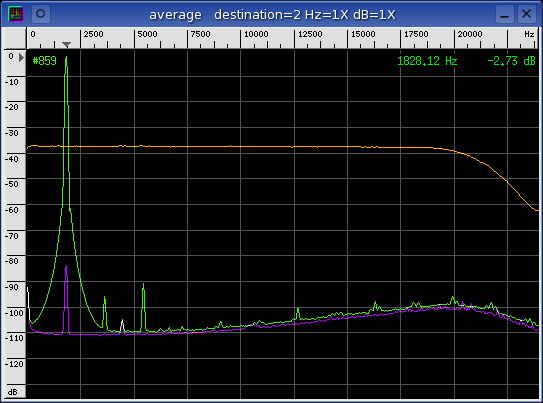
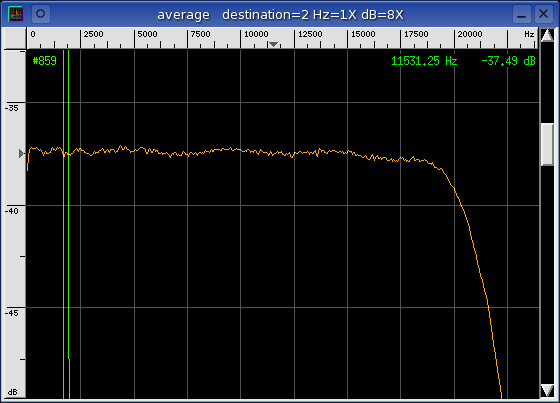
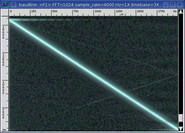
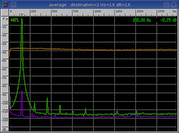
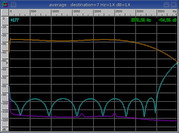
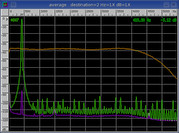
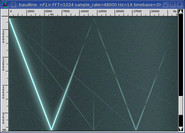
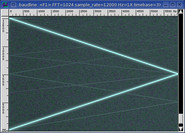
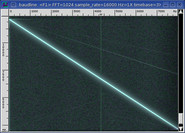
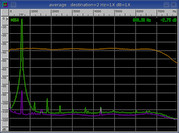
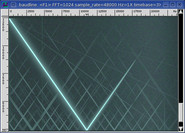
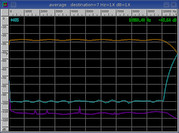
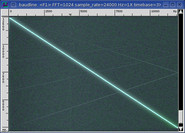
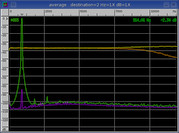
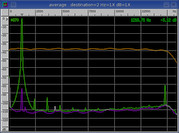
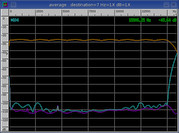
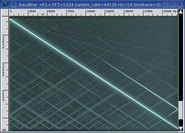
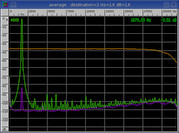
matched
The input and output sample rates are the same. This combination tests
the performance of both the ADC and the DAC in a matched mode of
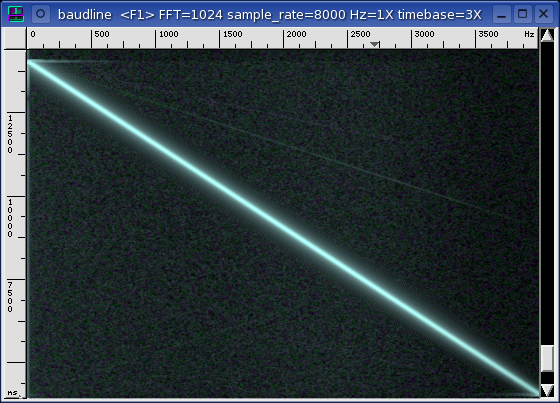
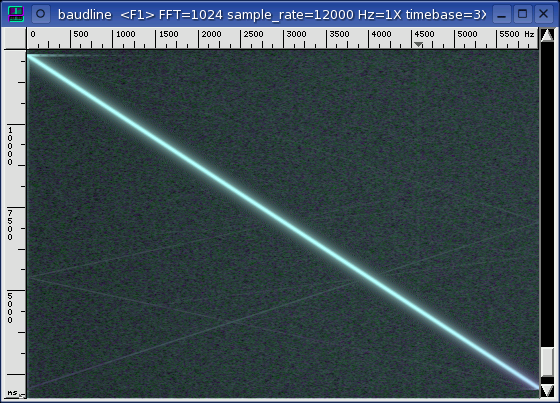
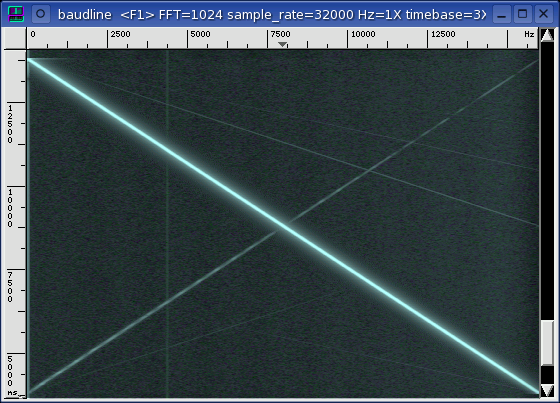
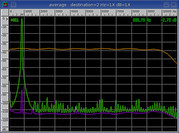
operation. The linear sine sweep signal in the left spectrogram display
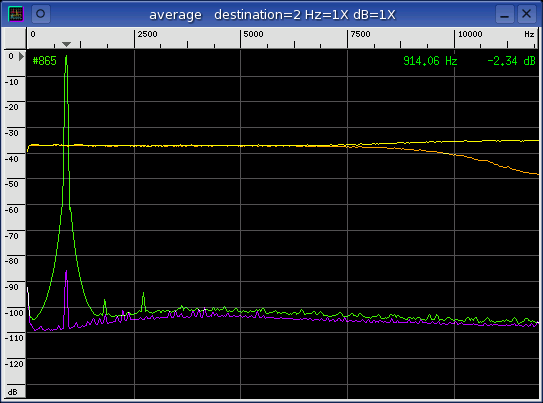
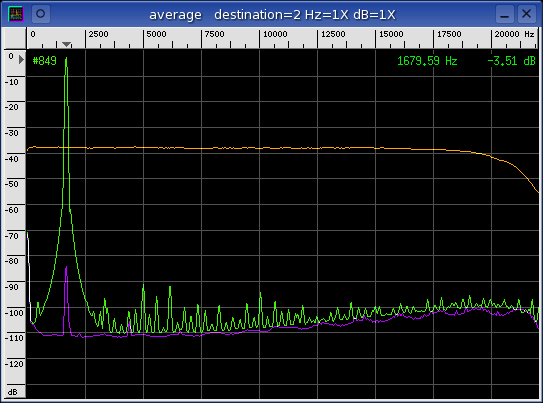
and the WGN (orange) in the Average window characterize the in-band filter
response. The sine wave (green) in the Average window is used for
distortion and crosstalk measurements. The sine leakage (purple) is used
for crosstalk measurement
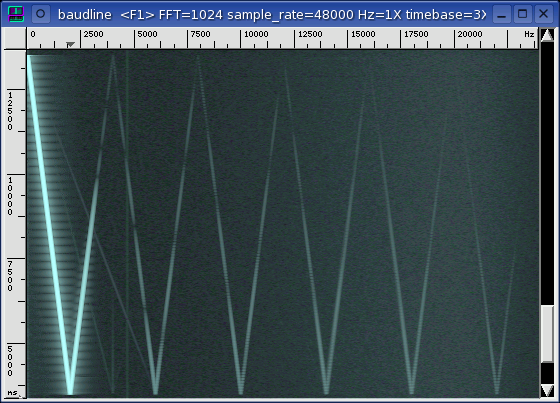
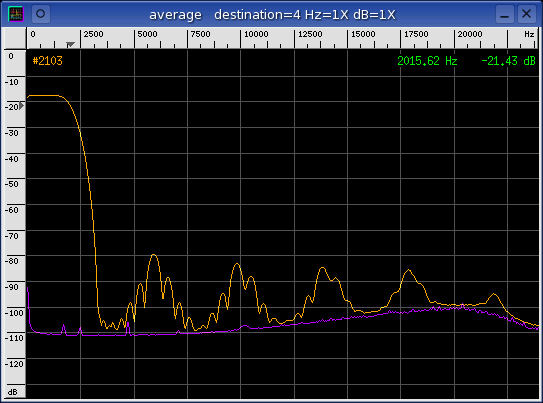
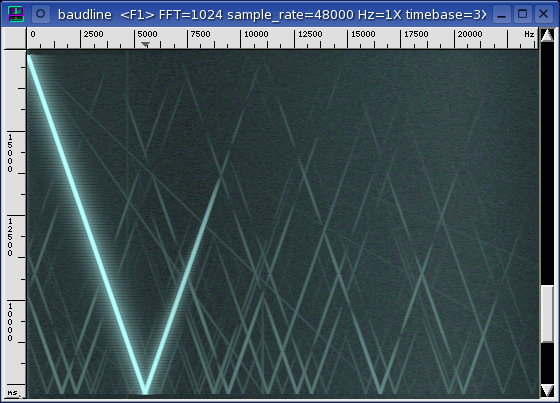
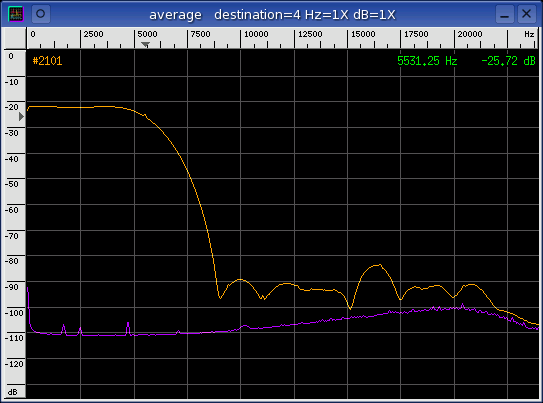
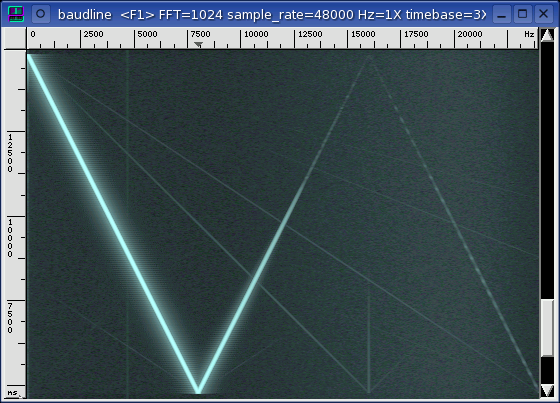
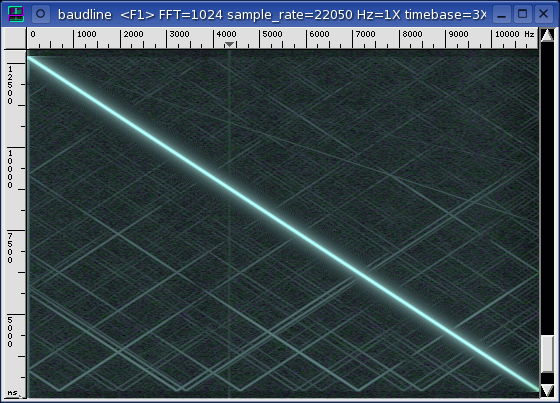
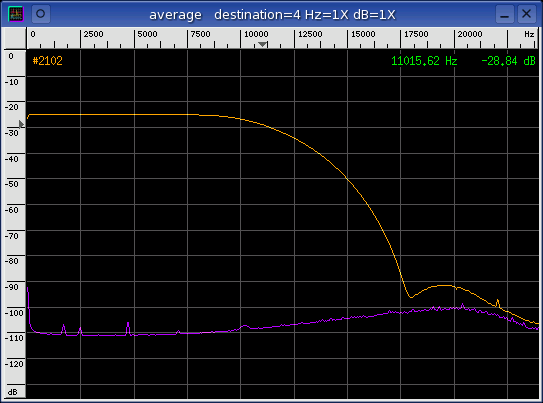
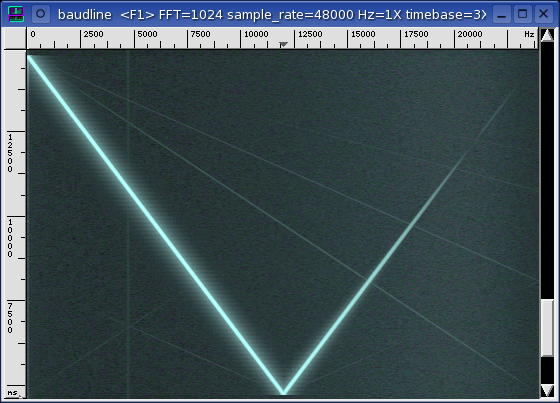
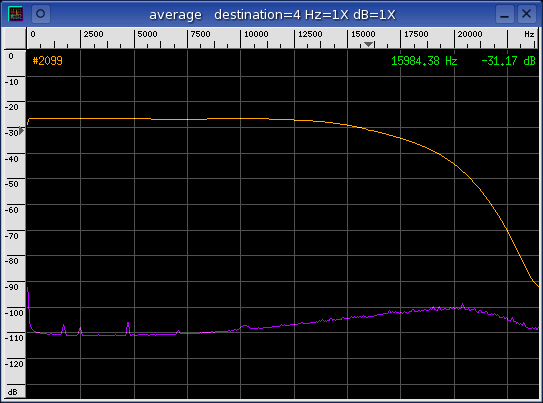
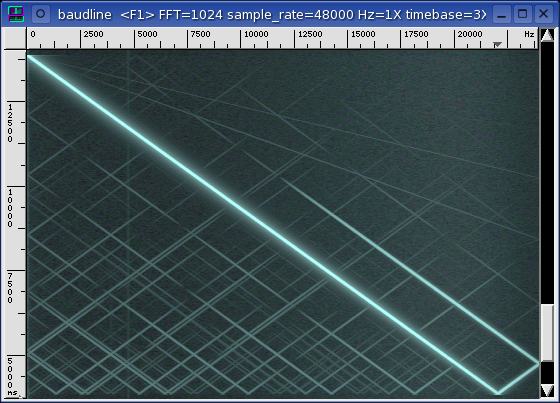
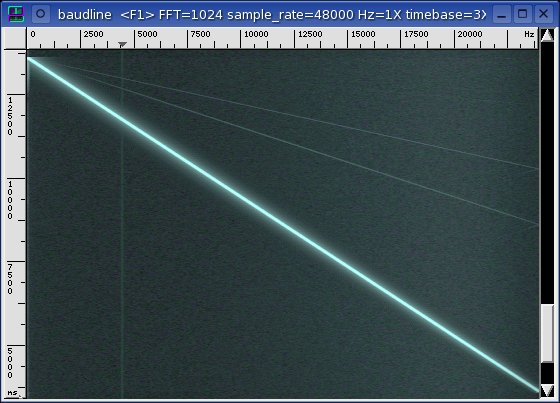
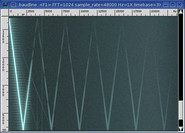
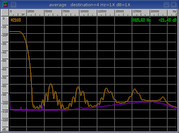
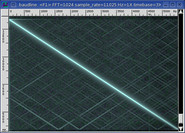
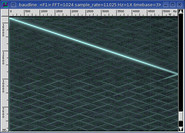
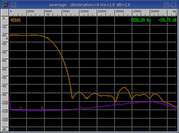
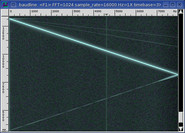
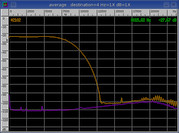
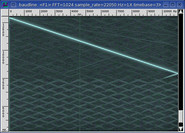
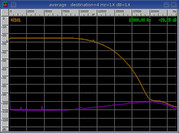
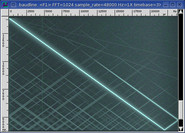
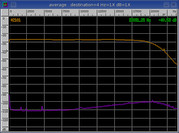
source
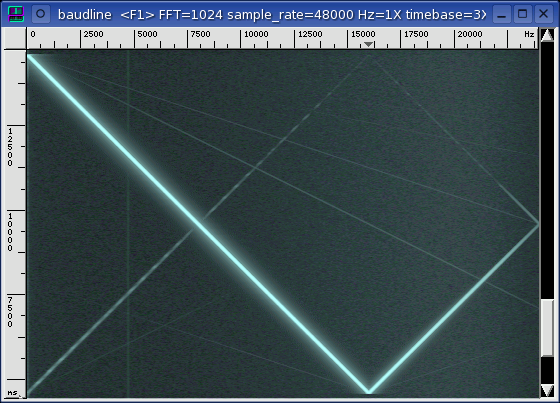
The sample rate of the input (sink) is the card's highest clean rate.
This combination tests the performance of the DAC. The linear sine sweep
signal in the middle spectrogram display characterizes the DAC filter
response. The position of the pass-band and the stop-band filter
transition is defined by the Nyquist frequency of the DAC. The noise
floor (purple) is the Average collection of a silent channel.
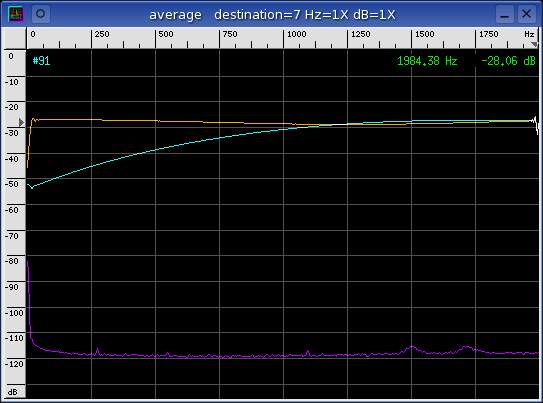
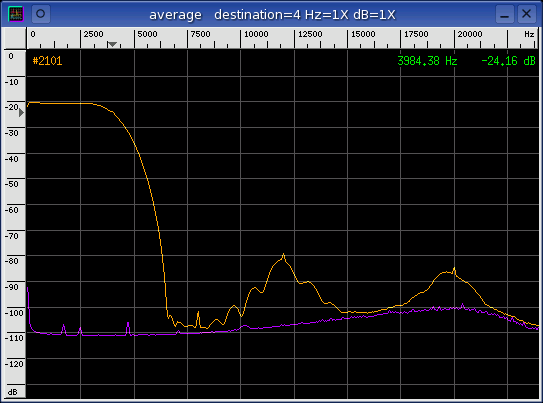
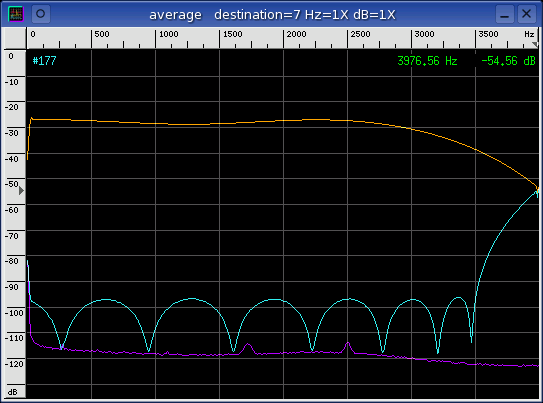
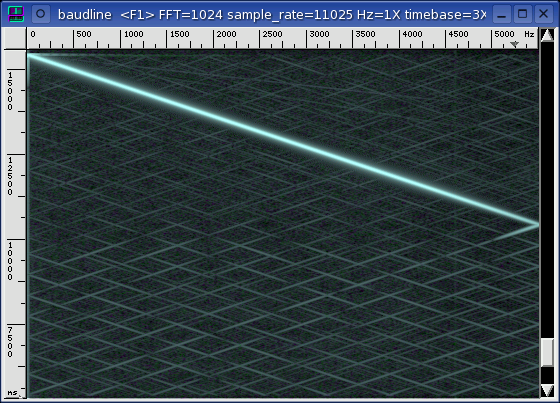
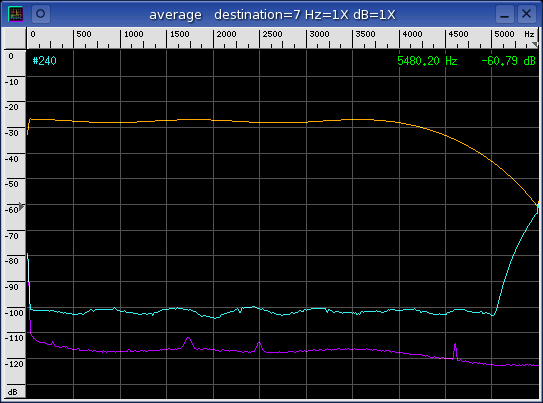
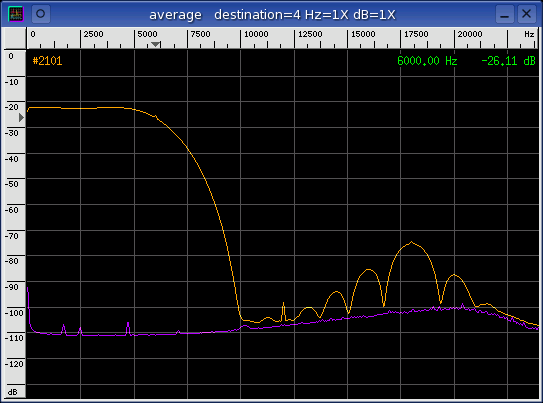
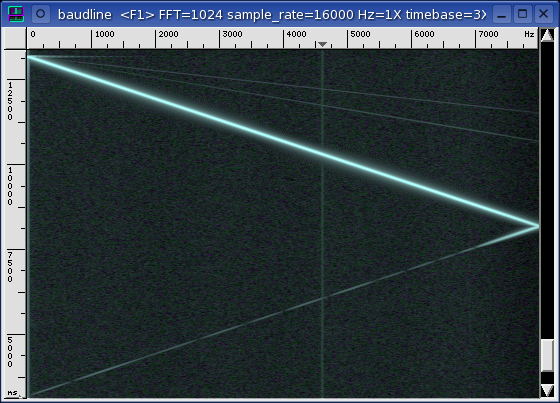
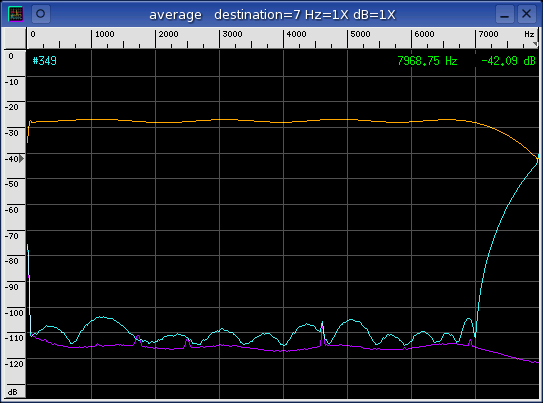
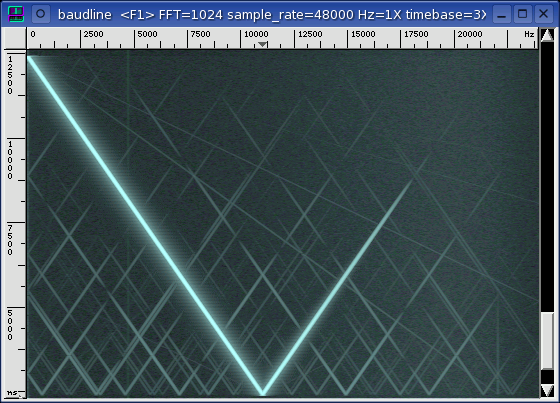
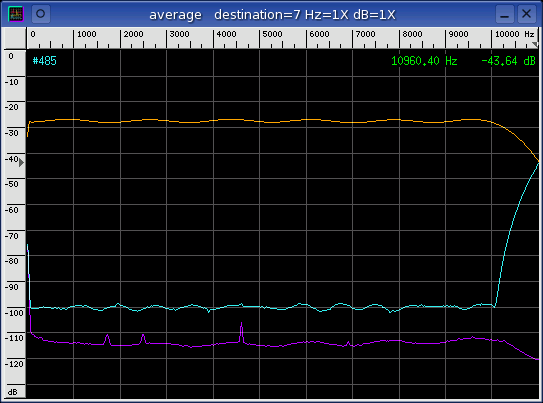
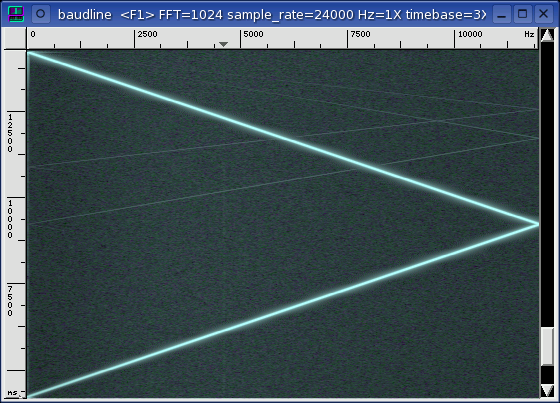
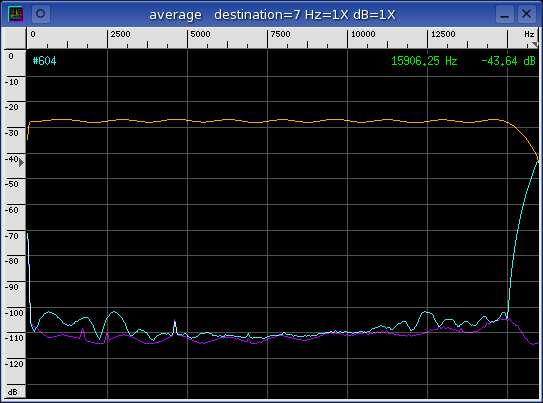
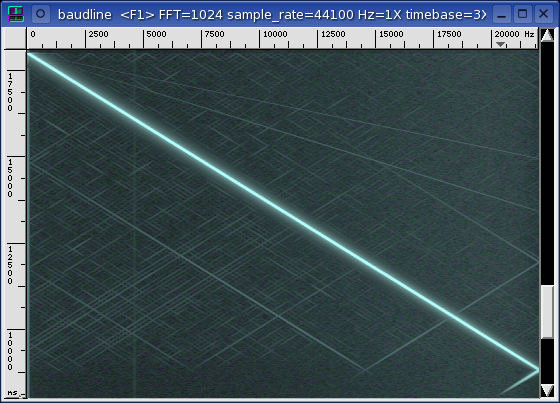
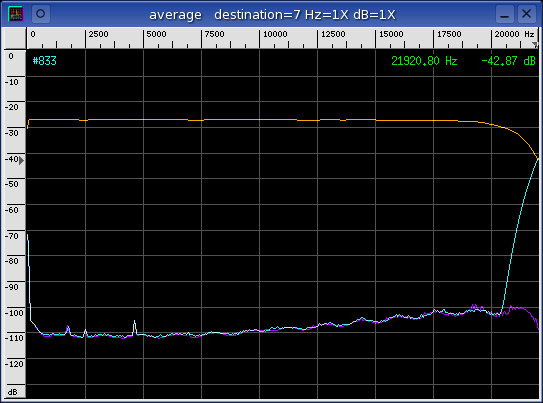
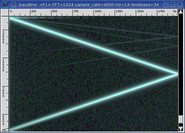
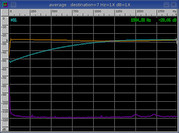
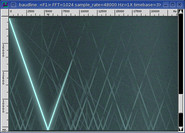
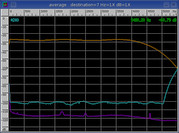
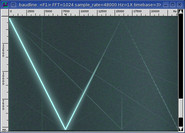
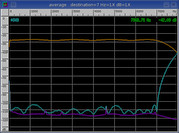
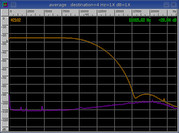
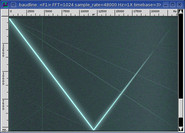
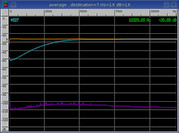
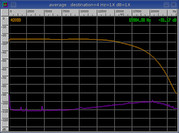
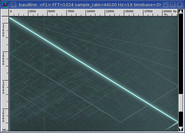
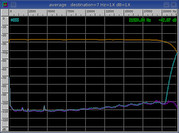
sink
The sample rate of the output (source) is the card's highest clean rate.
This combination tests the performance of the ADC. The linear sine sweep
signal in the rightmost spectrogram display and the orange curve in the Average
window below it characterize the ADC filter response. The position of
both the pass-band and the stop-band filter transition is defined by time in
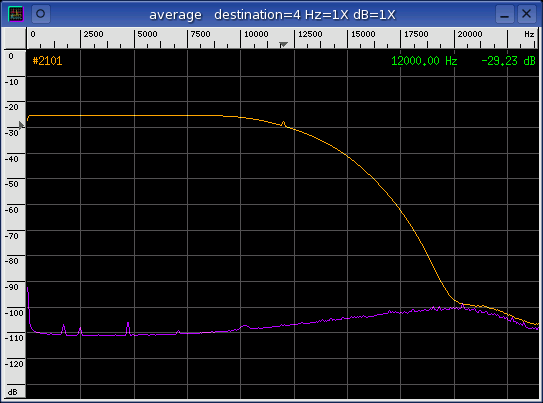
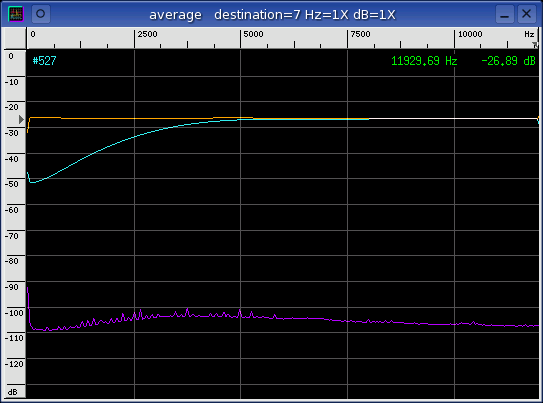
the spectrogram and by folded frequency in the Average window. The orange Average curve represents the pass-band while the cyan curve is a folded
representation of the stop-band ADC filter response. The noise floor
(purple) is the Average collection of a silent channel.
The naming convention for the columns below is (DAC -> ADC) where DAC
represents the source sample rate and ADC represents the sink sample
rate.
matched
|
source (DAC)
|
sink (ADC)
|
|
4000 -> 4000
|
4000 -> 48000
|
48000 -> 4000
|
|
|
|
|
|
|
No data. Sample rate is broken.
|
8000 -> 8000
|
8000 -> 48000
|
48000 -> 8000
|
|
|
|
|
|
|
|
11025 -> 11025
|
11025 -> 48000
|
48000 -> 11025
|
|
|
|
|
|
|
|
12000 -> 12000
|
12000 -> 48000
|
48000 -> 12000
|
|
|
|
|
|
|
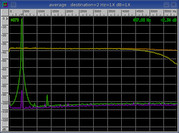
In the first average spectrum plot the yellow curve represents the left
channel and the orange curve represents the right channel.
|
16000 -> 16000
|
16000 -> 48000
|
48000 -> 16000
|
|
|
|
|
|
|
|
22050 -> 22050
|
22050 -> 48000
|
48000 -> 22050
|
|
|
|
|
|
|
|
24000 -> 24000
|
24000 -> 48000
|
48000 -> 24000
|
|
|
|
|
|
|
In the first average spectrum plot the yellow curve represents the left
channel and the orange curve represents the right channel.
|
32000 -> 32000
|
32000 -> 48000
|
48000 -> 32000
|
|
|
|
|
|
|
|
44100 -> 44100
|
44100 -> 48000
|
48000 -> 44100
|
|
|
|
|
|
|
Very mild passband ripple.
distortion
The following table of measurements were made using the technique described in
the sine distortion application
note. It is a full duplex test that uses a loopback of the tone generator
to measure the various distortion parameters. The stereo crosstalk
column is a measure of channel leakage that uses a sine wave channel and a
silent channel as the signal sources.
| rate |
SNR |
THD |
SINAD |
ENOB |
SFDR |
crosstalk |
|
| 4000 |
+90.24 dB |
-90.66 dB |
+87.44 dB |
+14.230 bits |
+93.72 dB |
-85.37 dB |
| 5510 |
|
|
|
|
|
|
| 8000 |
+91.22 dB |
-91.98 dB |
+88.57 dB |
+14.420 bits |
+94.74 dB |
-85.11 dB |
| 11025 |
+81.54 dB |
-87.25 dB |
+80.51 dB |
+13.080 bits |
+90.50 dB |
-85.94 dB |
| 12000 |
+78.53 dB |
-83.67 dB |
+77.37 dB |
+12.559 bits |
+89.22 dB |
-84.78 dB |
| 16000 |
+88.24 dB |
-89.91 dB |
+85.99 dB |
+13.989 bits |
+94.07 dB |
-84.90 dB |
| 22050 |
+82.58 dB |
-87.99 dB |
+81.48 dB |
+13.242 bits |
+93.01 dB |
-84.23 dB |
| 24000 |
+78.49 dB |
-83.54 dB |
+77.31 dB |
+12.549 bits |
+88.23 dB |
-83.78 dB |
| 32000 |
+77.76 dB |
-85.49 dB |
+77.08 dB |
+12.511 bits |
+78.61 dB |
-82.47 dB |
| 44100 |
+76.82 dB |
-81.39 dB |
+75.52 dB |
+12.251 bits |
+88.63 dB |
-81.35 dB |
| 48000 |
+78.79 dB |
-81.44 dB |
+76.90 dB |
+12.481 bits |
+88.93 dB |
-81.40 dB |
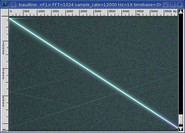
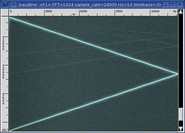
The 4000, 12000, and 24000 sample rates have poor ADC filters. The 12000
and 24000 rates are special cases in that they alternate left and right
channels that have nonexistent ADC filters (see the flat spectrum curves in the
sink column). It is very odd that the stereo channels have different
filters and it is also odd this orientation is reversed between 12000 and 24000.
Other than the above mentioned exception, the SB Live! has good filters with
fairly sharp roll offs. The 11025, 22050, and 44100 sample rates suffer
from some mild crosshatch aliasing. The 32000 rate has a cleaner looking
spectrogram sweep but the distinctive X-folded aliasing peak is about 20 dB
higher which makes it more significant than the crosshatch aliasing.
The distortion numbers look good and comparatively the crosshatch and X-folded
aliasing don't appear to hinder performance.
|
|
|
|
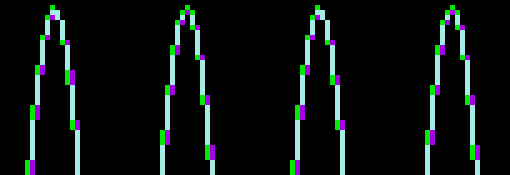
Quantization |
A white Gaussian noise signal source was generated and captured in full
duplex loopback fashion at each of the standard sample rates. The
Histogram plots below
show a unique sample distribution that is dependent on sample rate.
4000 ... 48000
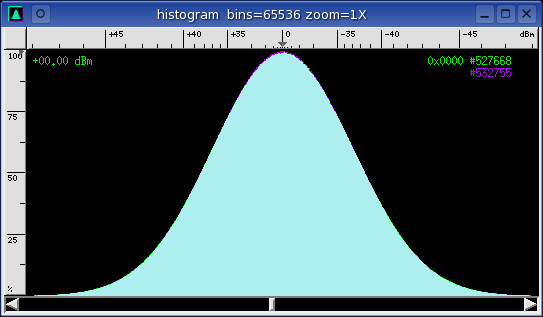
This histogram is the same for all the standard rates except 12000 and 24000
which are below.
12000
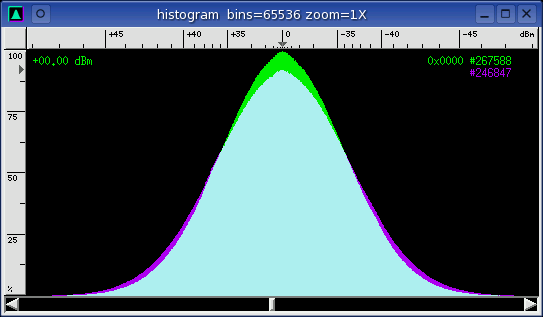
Right (purple) channel is spectrally flat.
24000
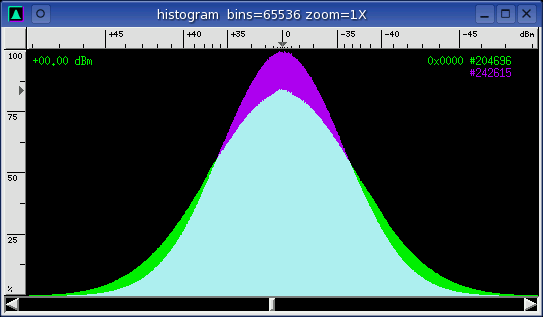
Left (green) channel is spectrally flat.
The wider Gaussian curves of the 12000 and 24000 spectrally flat channels
don't signify anything by themselves. They just highlight that something
unusual is at work.
|
|
|
|
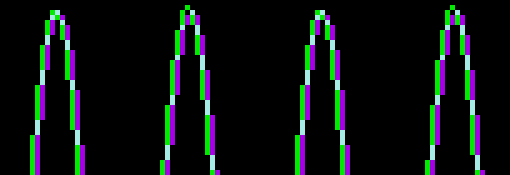
Channel Delay |
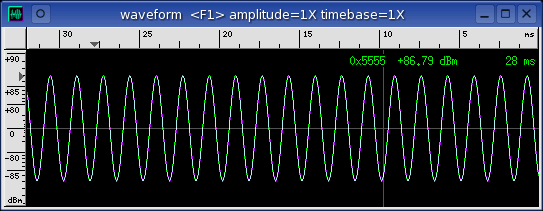
A sine wave signal was generated and captured in full duplex loopback
mode. The time domain response was observed with the
Waveform window where
the green curve represents the left channel and the purple curve represents
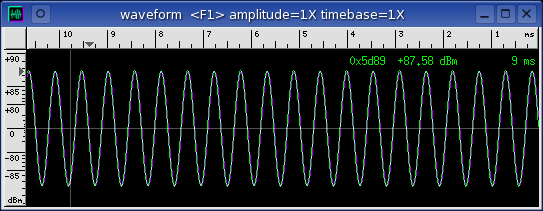
the right channel. A magnified view makes the spacing easier to
see. Two slightly different sample delay behaviors were seen and
grouped by sample rates.
Almost zero channel delay.
The channel delay is half a sample.
This inter channel delay will cause minor timing problems with stereo
signals. Minimal errors will be encountered while decoding
quadrature
signals for example. This delay will be imperceptible.
|
|
|
|
Analysis |
The 5510 rate is broken and it can't be used at all.
The 12000, 24000, and 48000 sample rates all have 0.0000 PPM loop error.
Unfortunately the 12000 and 24000 ADC filters are either extremely low quality
or completely nonexistent. Decimation by 2 filters are the easiest type
to design so this flaw must of been an oversight.
The 4000, 8000, 16000, and 32000 sample rates have a { +244 -122 +61 -30.5 }
PPM loop error progression. The PPM error grows by the same decimation
by 2 factor that the sample rate decreases. Not sure what the
significance of this is but the internal filtering circuitry is propagating and
multiplying the sampling rate error in successive decimation stages.
The 11025, 22050, and 44100 sample rates are related by having crosshatch
aliasing and a loop error progression of { +53.1485 +53.1485 -13.2850 }
PPM. This doesn't make much of an effect on their distortion measurements
and filter shapes since they are both pretty good.
|
|
|
|
Conclusion |
The Sound Blaster Live! card is very quirky and setting up the mixer for the
best performance is a very difficult task. Failure to adjust mixer
controls to optimal values will result in the loss of a couple bits of ENOB.
Avoid recording at the 4000, 12000, and 24000 sample rates since they have
poor or nonexistent filters. Audio record and playback at all of the
other sample rates is recommended. To avoid subtle aliasing don't use
the 11025, 22050, 32000, or 44100 sample rates. For full duplex work
the best rates to use are 8000, 16000, and 48000.
Contrary to popular opinion, the SB Live! has quality filters and distortion
performance numbers. The only major problems the card suffers from is
strange sample rate behavior and intermittent data loss caused by poor ALSA
drivers. The problems go away when the OSS drivers are used.
|
|
|
|
|