|
|
|
Information |
Sound Blaster 16 PCI
| vendor |
Creative Labs
|
| product |
Ensoniq AudioPCI, Sound Blaster 16 PCI, PCI64 |
| interface |
PCI |
| duplex |
full |
| channels |
2 |
| resolution |
16 bits |
| max rate |
48 Ksample/sec |
| chipset |
ES1371 AudioPCI-97 rev 7 |
| codec |
SigmaTel STAC9708/11
|
| operating system |
Red Hat 7.3 Linux x86 2.6.7 |
driver |
ens1371 ALSA 1.0.4 |
buffer size |
input 64 KB, output 64 KB |
| test date |
Aug 18 2005 |
| notes |
The card has 2 ADCs and 4 DACs. For optimal distortion measurements
set the "Vol" mixer slider to the maximum value with an external mixer program.
|
This card is part of the Full Duplex DAQ comparison
survey.
|
|
|
|
Sample Rate |
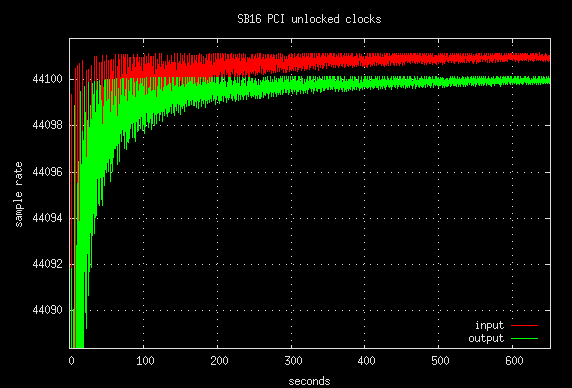
The sample rate on DAQ cards is not a fixed absolute constant. Like time,
it fluctuates, and it is difficult to measure accurately. Sometimes there
are relationships between the input and output sample rates that can reveal
interesting details about the inner working machinery.
The following table of measurements use a technique described in the
sample rate stability application
note. The rate column is the sample rate value that the collection
hardware is programmed to. The in/out rate and in/out error
columns are absolute measurements of the ADC / DAC clock. The
loop error column uses a tone generator loopback method for a high
accuracy measurement of the relative difference between the ADC and the DAC
clocks. The three error
PPM columns are theoretically
related by the formula: "in_error - out_error = loop_error"
| rate |
in rate |
out rate |
in error |
out error |
loop error |
| 4000 |
4000.00460 |
4000.00460 |
+2.0675 PPM |
+2.0675 PPM |
-487.87 PPM |
| 5510 |
5510.01525 |
5510.01997 |
+2.7677 PPM |
+3.6243 PPM |
-0.8574 PPM |
| 8000 |
8000.01144 |
8000.01144 |
+1.4300 PPM |
+1.4300 PPM |
-487.92 PPM |
| 11025 |
11025.0543 |
11024.9870 |
+4.9252 PPM |
-1.1791 PPM |
+6.1349 PPM |
| 12000 |
12000.0129 |
12000.0129 |
+1.0750 PPM |
+1.0750 PPM |
+0.0000 PPM |
| 16000 |
16000.0097 |
16000.0097 |
+0.6062 PPM |
+0.6062 PPM |
-488.05 PPM |
| 22050 |
22050.2609 |
22050.0624 |
+11.8322 PPM |
+2.8299 PPM |
+8.9930 PPM |
| 24000 |
24000.0365 |
24000.0365 |
+1.5208 PPM |
+1.5208 PPM |
+0.0000 PPM |
| 32000 |
32000.0607 |
32000.0302 |
+1.8969 PPM |
+0.9438 PPM |
+0.9537 PPM |
| 44100 |
44101.0821 |
44100.0672 |
+24.5374 PPM |
+1.5238 PPM |
+23.0171 PPM |
| 48000 |
48000.1027 |
48000.1027 |
+2.1396 PPM |
+2.1396 PPM |
+0.0000 PPM |
The 12000, 24000, and 48000 sample rates all have a +0.0000 PPM
loop error measurement. This means that the ADC and DAC clocks
are in lockstep at those particular sample rates.
The 4000, 8000, and 16000 sample rates all have a -488 PPM loop error
measurement. This is a lot of error and it indicates that a common
error mechanism is at work for all three of those rates. It is
interesting that the in error and the out error measurements are
equal which suggests a locked fragment clock. This is in conflict with
the -488 PPM loop error measurement. The significance of this will
be analyzed below.
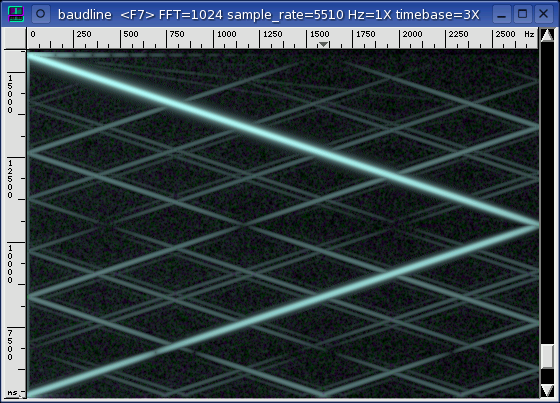
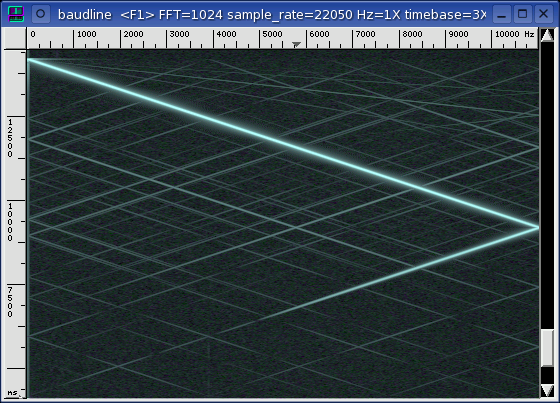
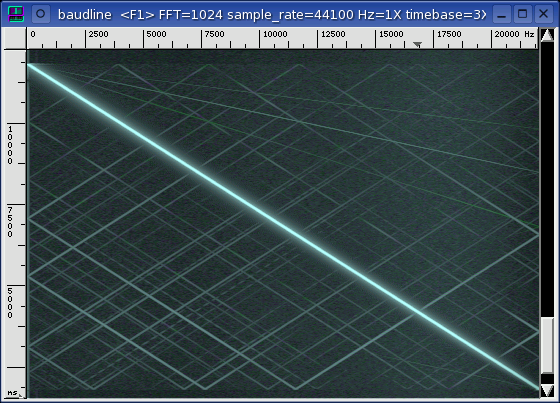
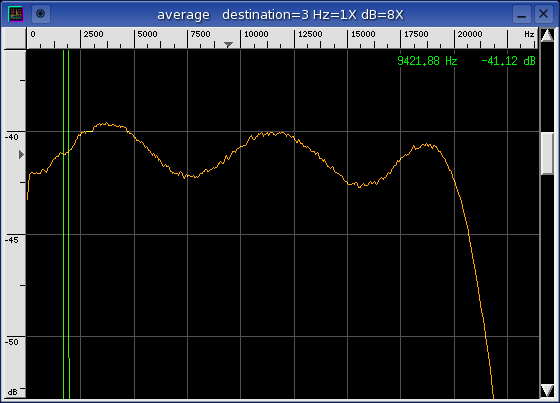
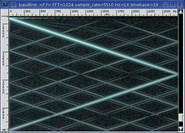
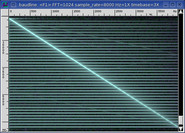
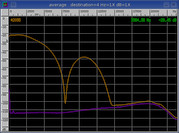
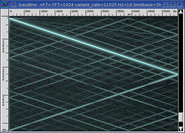
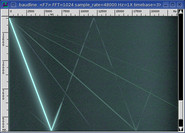
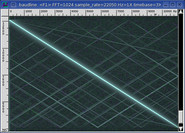
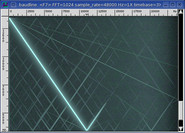
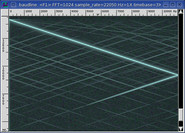
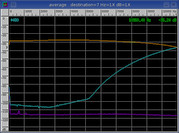
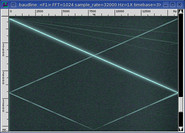
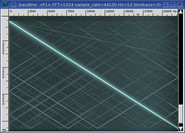
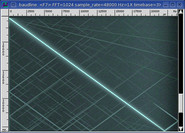
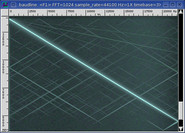
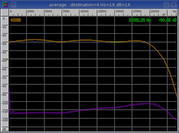
The { -0.8574, +6.1349, +8.9930, +23.0171 } PPM progression for the 5510,
11025, 22050, and 44100 sample rates is unusual. The difference between
the in error and the out error are almost exactly equal to the
loop error measurement. This means that the resampling circuitry
is driving the fragment clocks but the input and output sides are not
symmetrical. The significance of this is unknown. Below is the
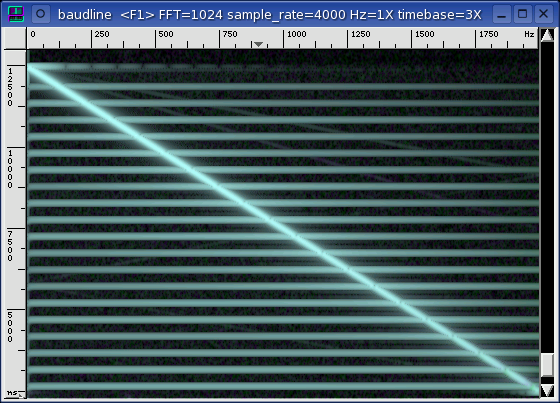
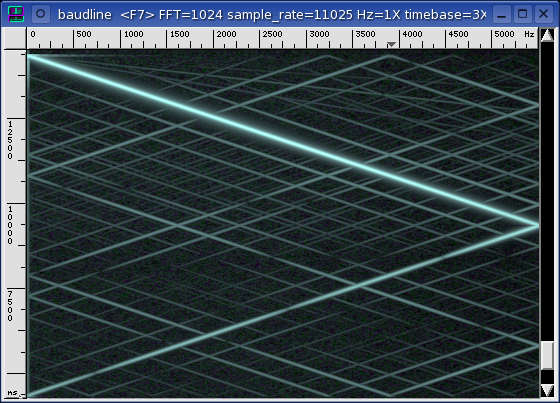
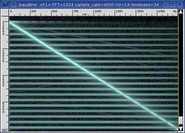
44100 rate plot that shows two parallel trajectories.
|
|
|
|
Frequency Domain
|
The sound card's input and output jacks are connected with a short external
cable and run in full duplex mode. This is a loopback test and baudline's
tone generator is the signal source. Distortion, noise floor, filter
response, and inter channel crosstalk are the frequency domain measurements of
interest in this section.
The signal test sources are a pure sine wave, a linear sine sweep, and
WGN. The sine wave is
used for the distortions and crosstalk measurements. The linear sine
sweep and WGN are used for the filter characterization measurement.
Both are an application of the
swept sine vs. WGN technique
and are equivalent measures of the frequency response.
Since spectral performance is a function of sample rate, each of the sound
card's native rates will be tested. The highest sample rate is usually
the cleanest and this is advantageous because it allows the isolated testing
of the ADC and the
DAC. The matched,
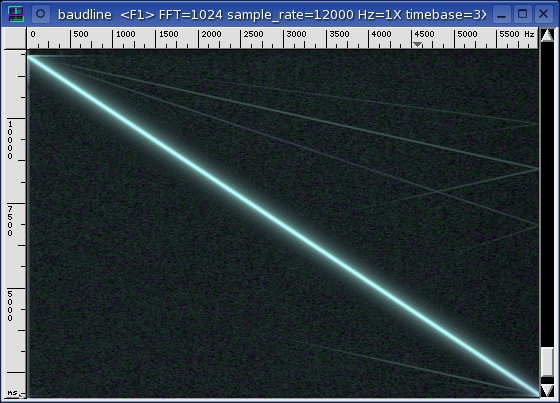
source, and sink sample rate combinations are described below.
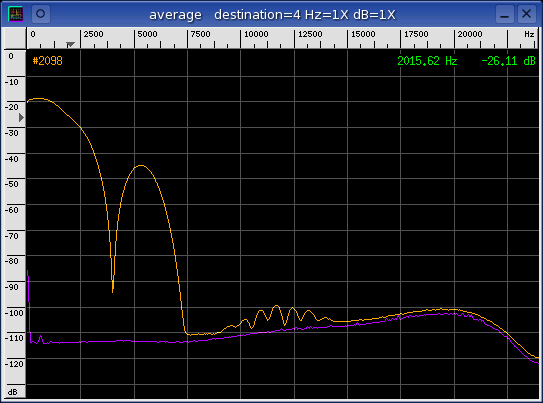
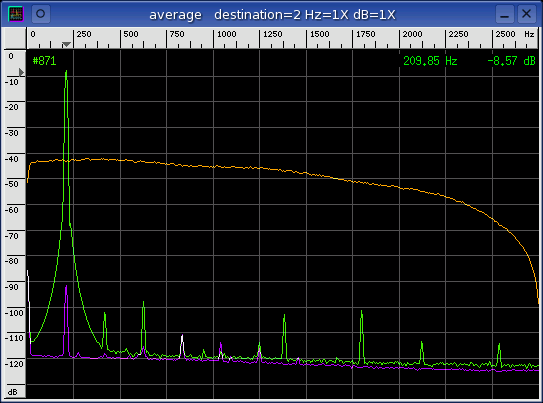
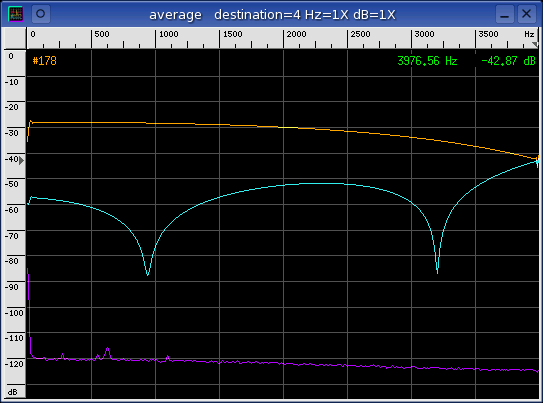
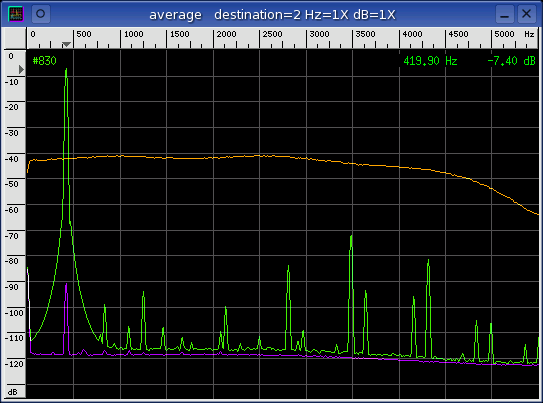
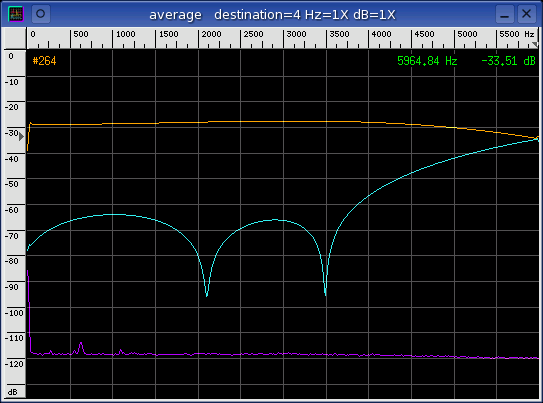
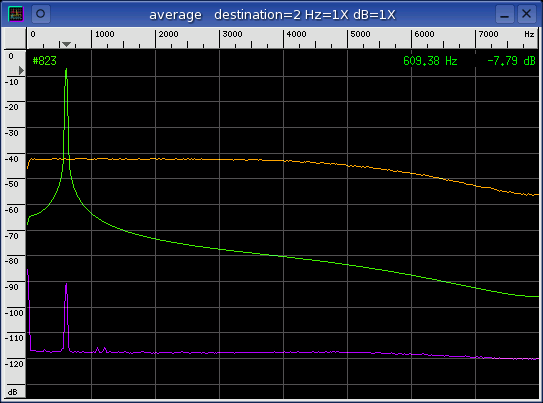
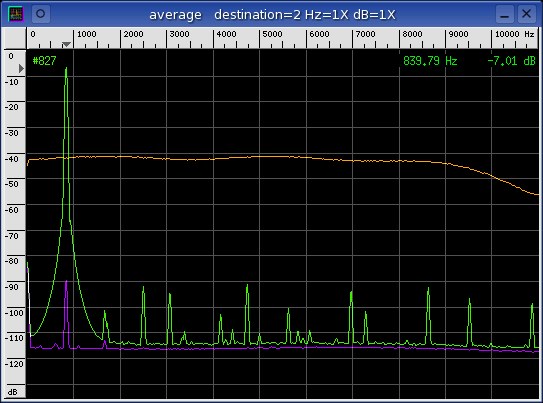
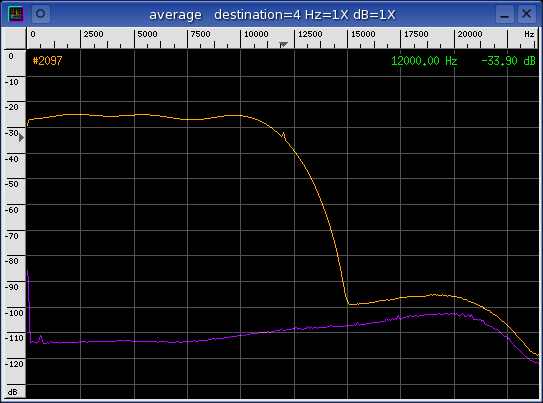
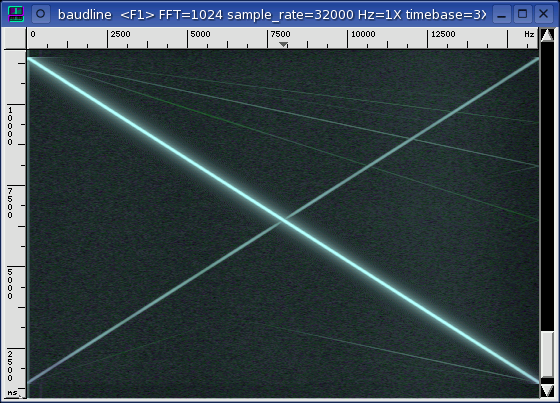
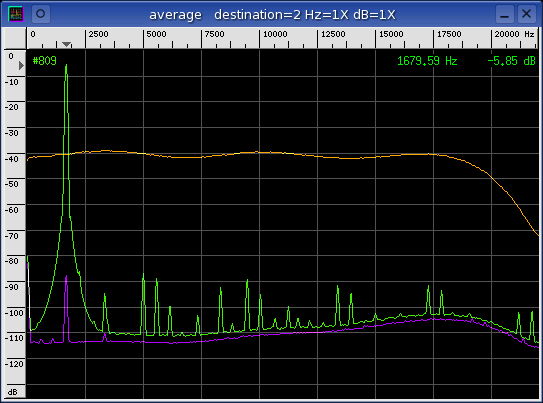
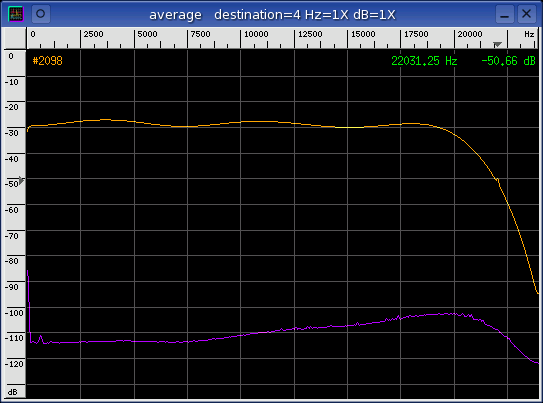
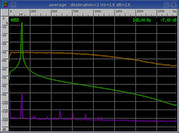
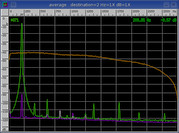
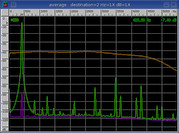
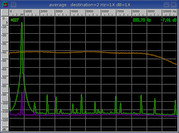
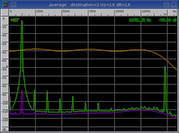
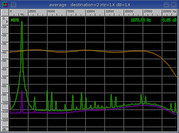
matched
The input and output sample rates are the same. This combination tests
the performance of both the ADC and the DAC in a matched mode of
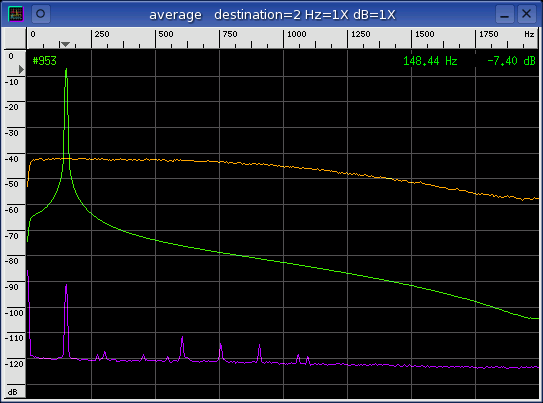
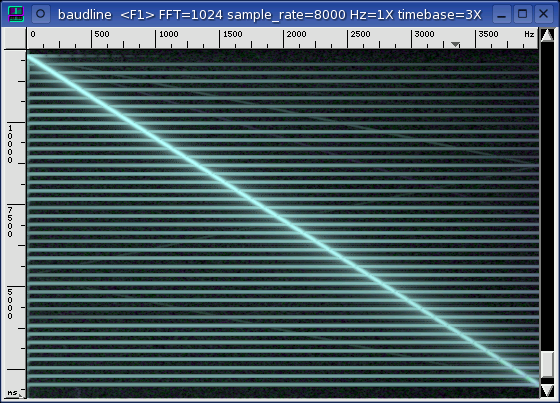
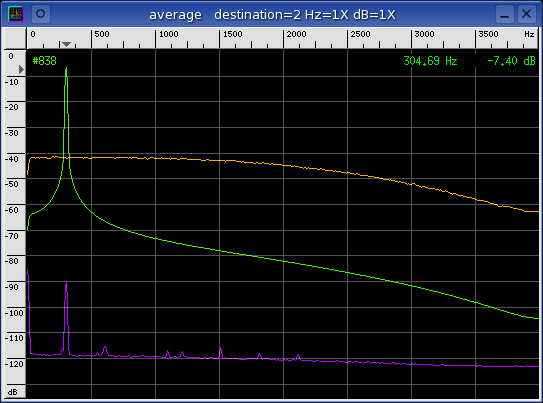
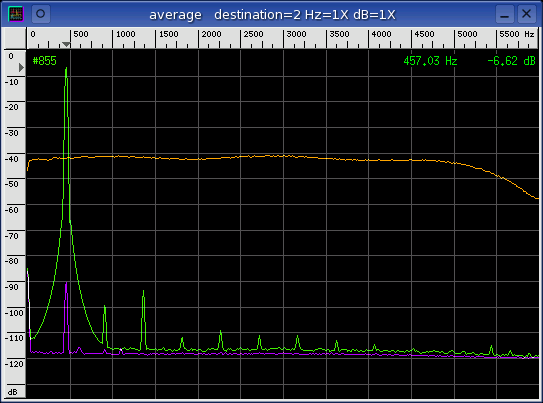
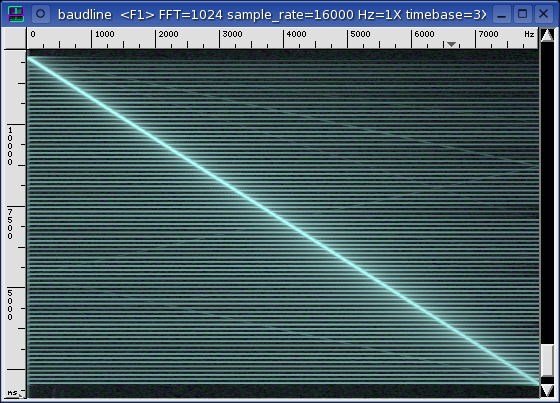
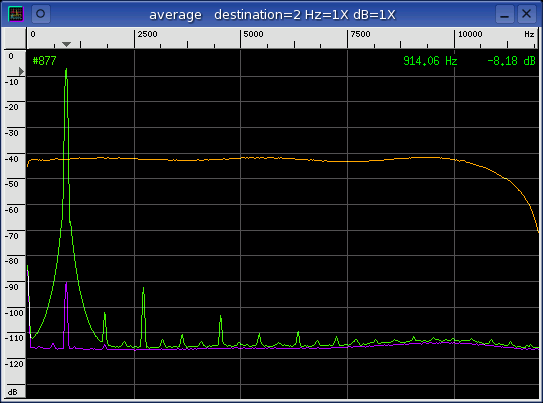
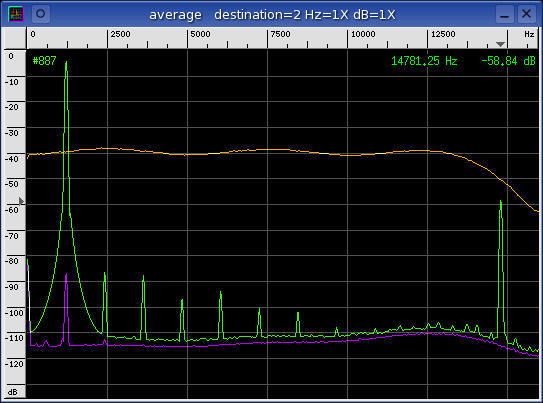
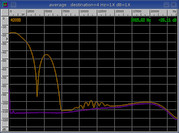
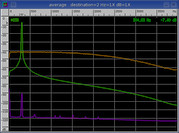
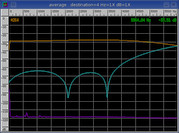
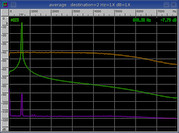
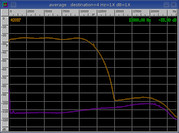
operation. The linear sine sweep signal in the left spectrogram display
and the WGN (orange) in the Average window characterize the in-band filter
response. The sine wave (green) in the Average window is used for
distortion and crosstalk measurements. The sine leakage (purple) is used
for crosstalk measurement
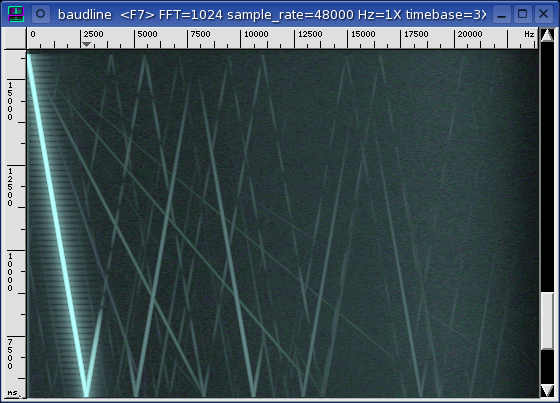
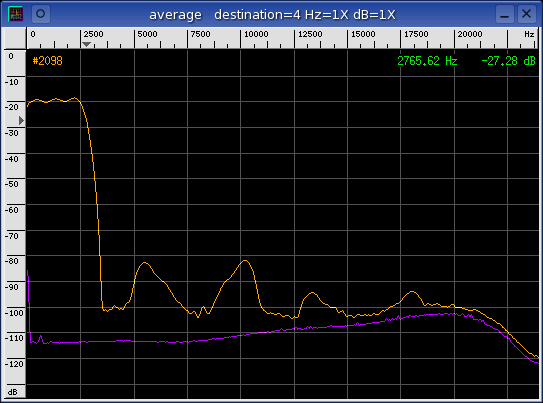
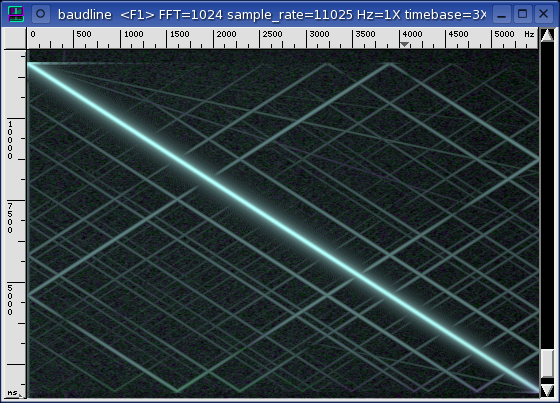
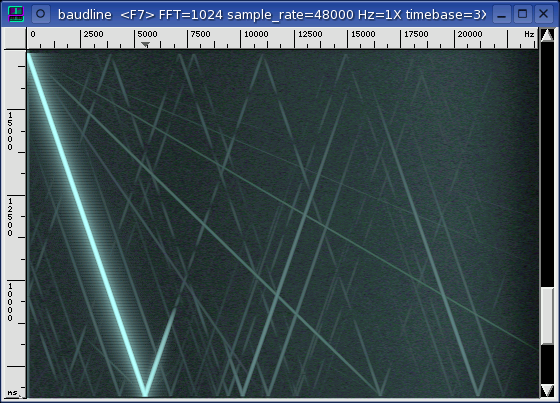
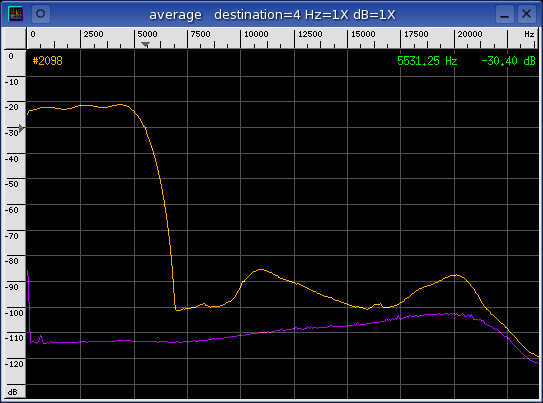
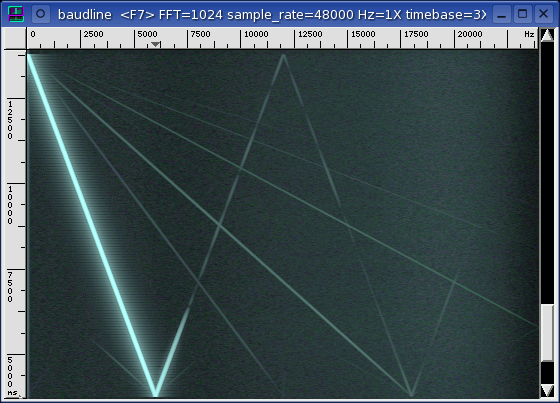
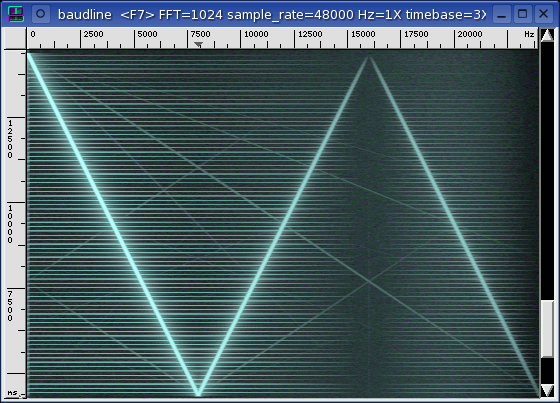
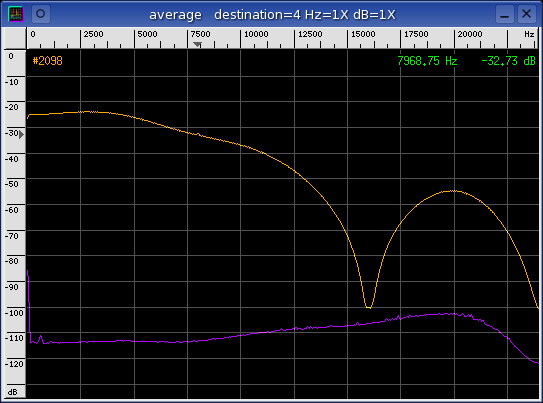
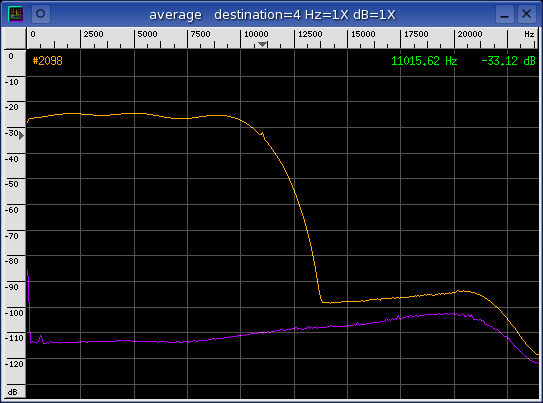
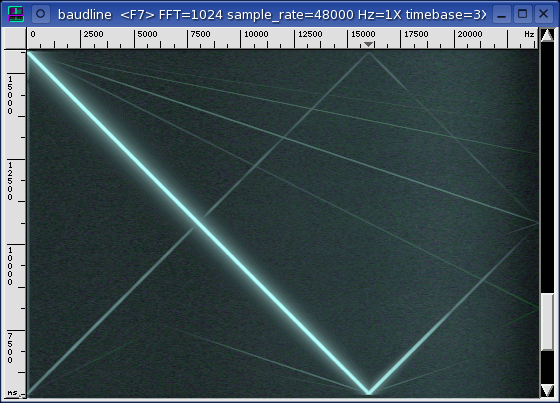
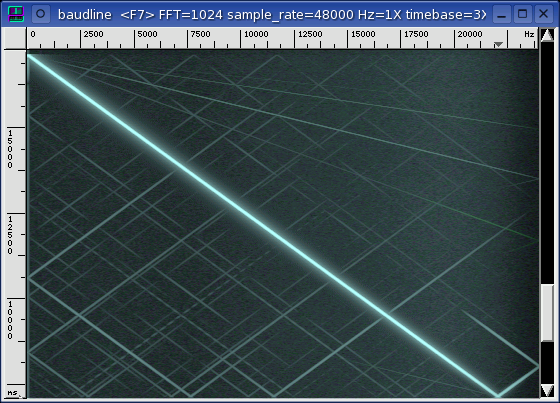
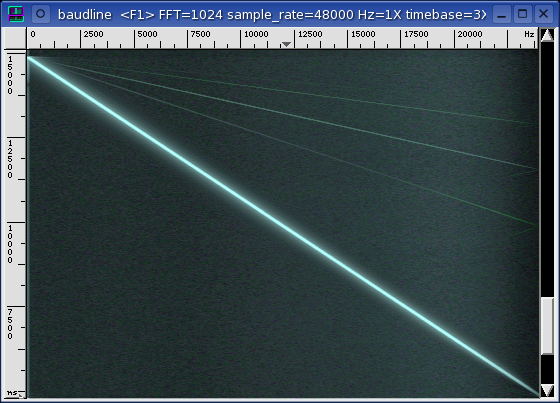
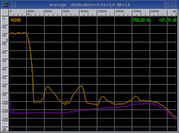
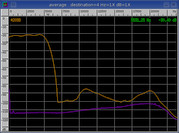
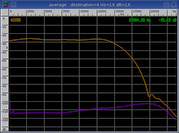
source
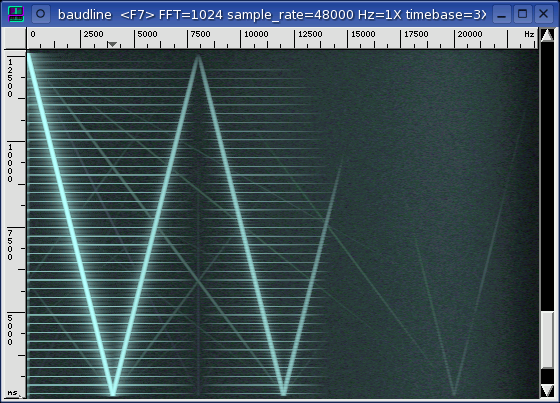
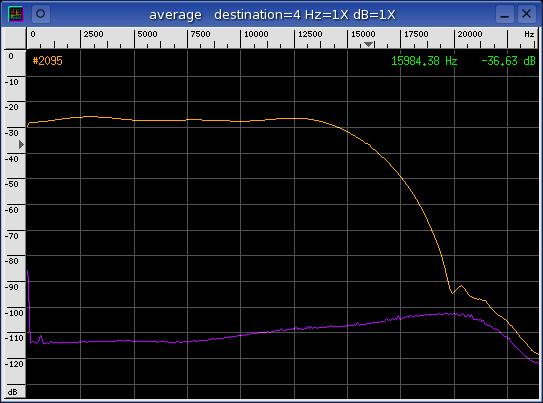
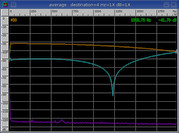
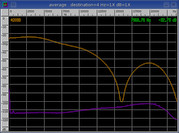
The sample rate of the input (sink) is the card's highest clean rate.
This combination tests the performance of the DAC. The linear sine sweep
signal in the middle spectrogram display characterizes the DAC filter
response. The position of the pass-band and the stop-band filter
transition is defined by the Nyquist frequency of the DAC. The noise
floor (purple) is the Average collection of a silent channel.
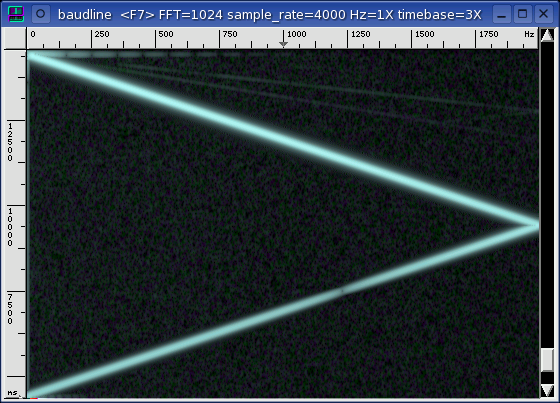
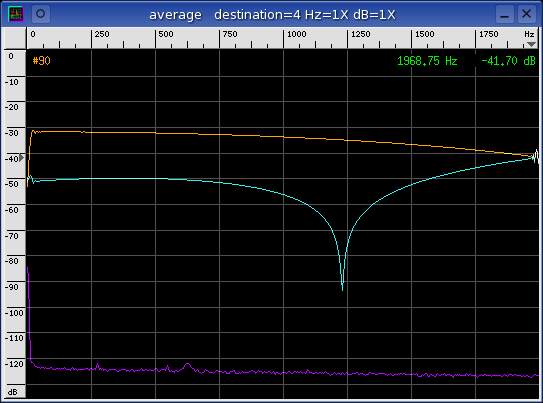
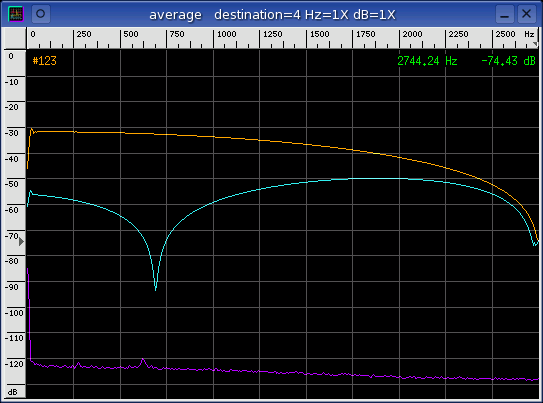
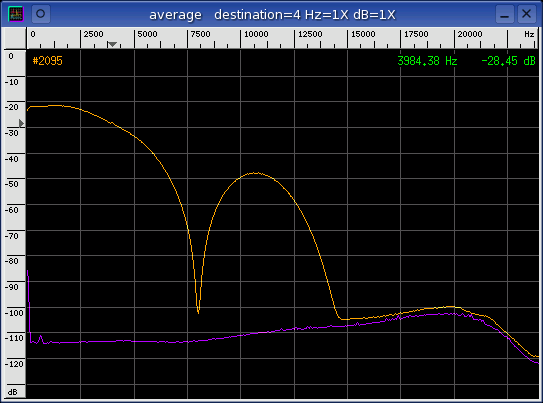
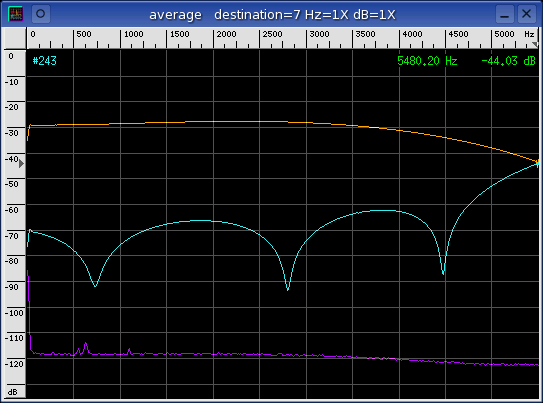
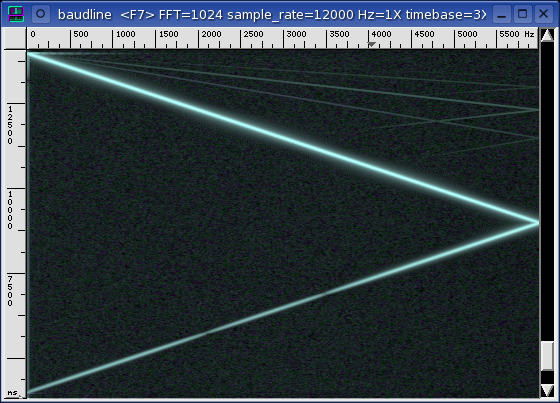
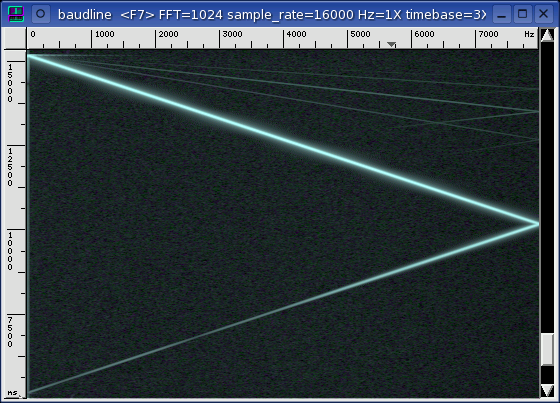
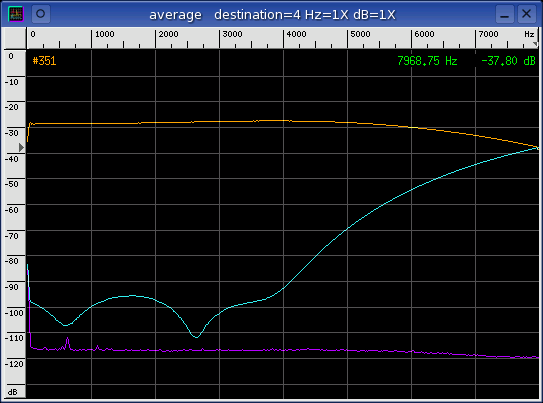
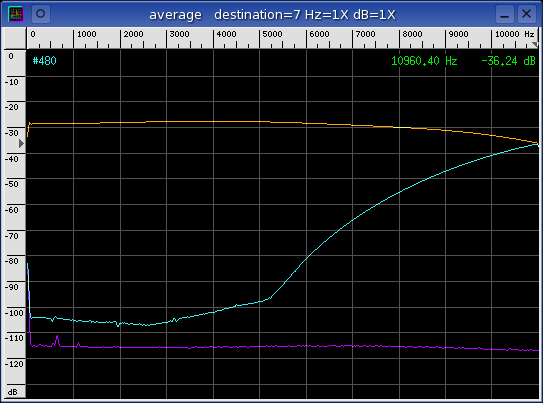
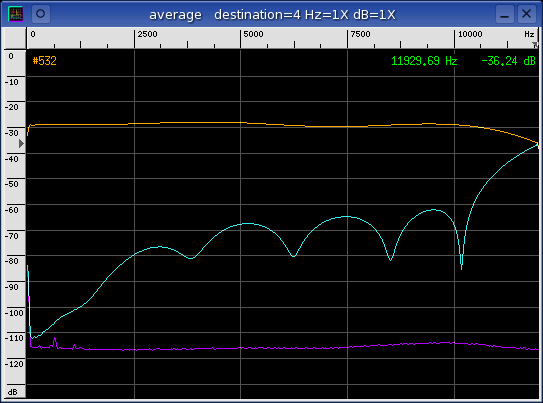
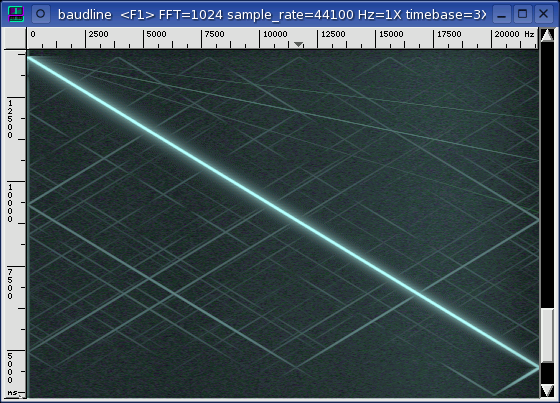
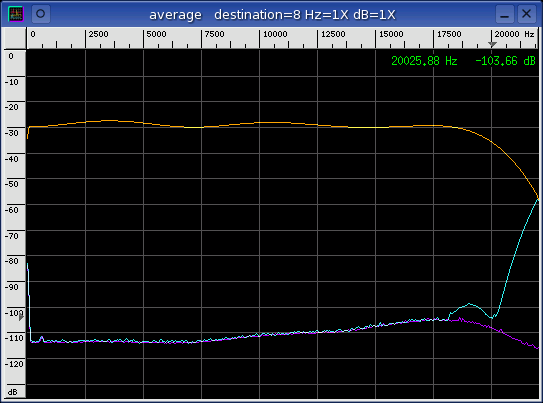
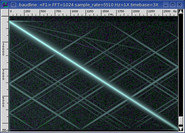
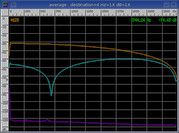
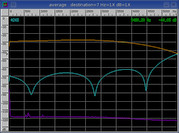
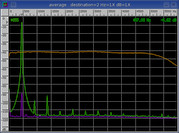
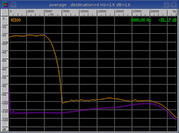
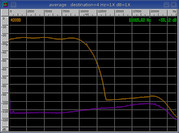
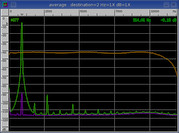
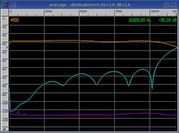
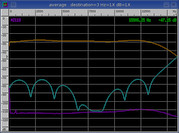
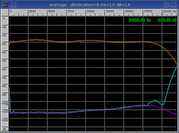
sink
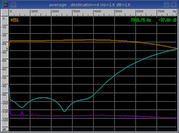
The sample rate of the output (source) is the card's highest clean rate.
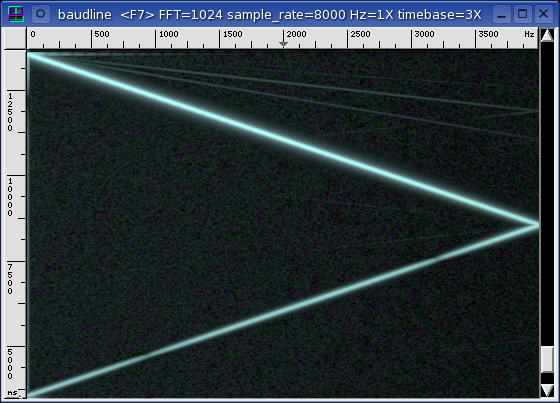
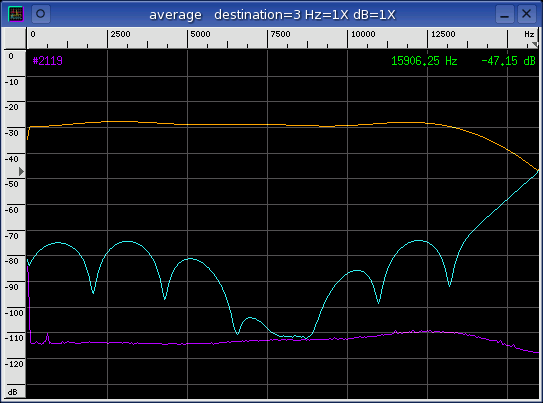
This combination tests the performance of the ADC. The linear sine sweep
signal in the rightmost spectrogram display and the orange curve in the Average
window below it characterize the ADC filter response. The position of
both the pass-band and the stop-band filter transition is defined by time in
the spectrogram and by folded frequency in the Average window. The orange Average curve represents the pass-band while the cyan curve is a folded
representation of the stop-band ADC filter response. The noise floor
(purple) is the Average collection of a silent channel.
The naming convention for the columns below is (DAC -> ADC) where DAC
represents the source sample rate and ADC represents the sink sample
rate.
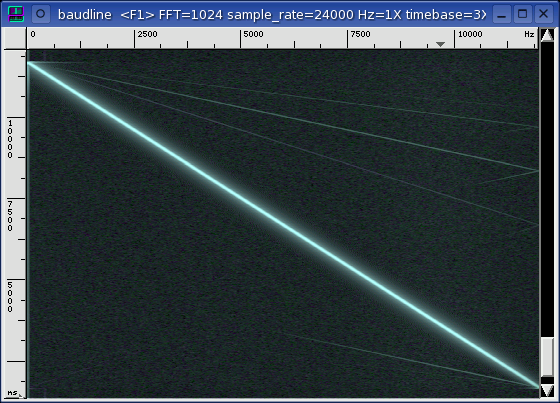
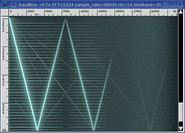
matched
|
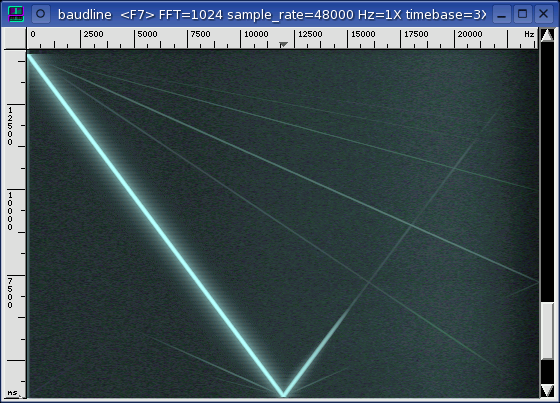
source (DAC)
|
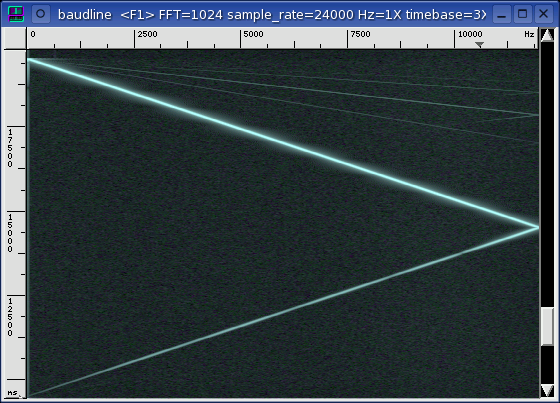
sink (ADC)
|
|
4000 -> 4000
|
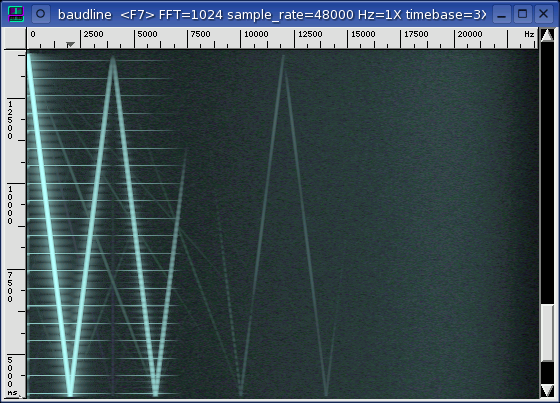
4000 -> 48000
|
48000 -> 4000
|
|
|
|
|
|
|
The wideband pulses in both the 4000 matched and source spectrogram sweeps
have a 0.512 second period (2048 samples).
|
5510 -> 5510
|
5510 -> 48000
|
48000 -> 5510
|
|
|
|
|
|
|
|
8000 -> 8000
|
8000 -> 48000
|
48000 -> 8000
|
|
|
|
|
|
|
The wideband pulses in both the 8000 matched and source spectrogram sweeps
have a 0.256 second period (2048 samples).
|
11025 -> 11025
|
11025 -> 48000
|
48000 -> 11025
|
|
|
|
|
|
|
|
12000 -> 12000
|
12000 -> 48000
|
48000 -> 12000
|

|
|
|
|
|
|
|
16000 -> 16000
|
16000 -> 48000
|
48000 -> 16000
|
|
|
|
|
|
|
The wideband pulses in both the 16000 matched and source spectrogram sweeps
have a 0.128 second period (2048 samples).
|
22050 -> 22050
|
22050 -> 48000
|
48000 -> 22050
|
|
|
|
|
|
|
|
24000 -> 24000
|
24000 -> 48000
|
48000 -> 24000
|

|
|
|
|
|
|
|
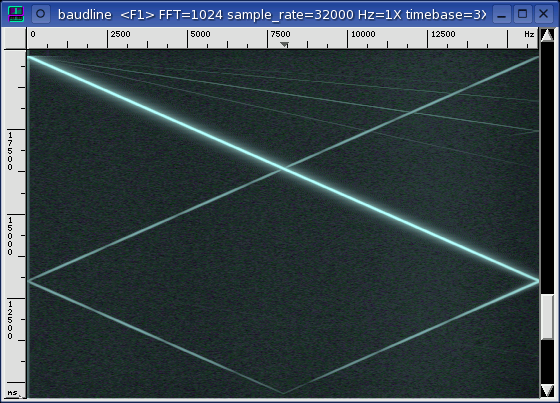
32000 -> 32000
|
32000 -> 48000
|
48000 -> 32000
|
|
|
|
|
|
|
|
44100 -> 44100
|
44100 -> 48000
|
48000 -> 44100
|
|
|
|
|
|
|
The 48000 filter response has a 3 dB peak-to-peak ripple. The propagation
of this ripple is visible in the filter response in many of the standard sample
rates.
distortion
The following table of measurements were made using the technique described in
the sine distortion application
note. It is a full duplex test that uses a loopback of the tone generator
to measure the various distortion parameters. The stereo crosstalk
column is a measure of channel leakage that uses a sine wave channel and a
silent channel as the signal sources.
| rate |
SNR |
THD |
SINAD |
ENOB |
SFDR |
crosstalk |
|
| 4000 |
+97.33 dB |
-inf.00 dB |
+97.33 dB |
+15.874 bits |
+97.33 dB |
-83.86 dB |
* |
| 5510 |
+88.02 dB |
-88.08 dB |
+85.04 dB |
+13.832 bits |
+90.55 dB |
-83.74 dB |
| 8000 |
+93.66 dB |
-inf.00 dB |
+93.67 dB |
+15.264 bits |
+94.63 dB |
-83.84 dB |
* |
| 11025 |
+64.16 dB |
-83.56 dB |
+64.86 dB |
+10.357 bits |
+64.86 dB |
-83.70 dB |
| 12000 |
+88.14 dB |
-85.09 dB |
+83.34 dB |
+13.551 bits |
+87.26 dB |
-83.78 dB |
| 16000 |
+83.18 dB |
-inf.00 dB |
+83.18 dB |
+13.523 bits |
+83.18 dB |
-83.68 dB |
* |
| 22050 |
+78.41 dB |
-83.82 dB |
+77.31 dB |
+12.549 bits |
+84.82 dB |
-83.03 dB |
| 24000 |
+85.50 dB |
-83.31 dB |
+81.26 dB |
+13.205 bits |
+85.70 dB |
-83.09 dB |
| 32000 |
+54.06 dB |
-78.89 dB |
+54.05 dB |
+8.685 bits |
+54.07 dB |
-82.76 dB |
| 44100 |
+74.88 dB |
-77.71 dB |
+73.06 dB |
+11.842 bits |
+80.84 dB |
-82.21 dB |
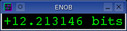
| 48000 |
+78.63 dB |
-77.99 dB |
+75.29 dB |
+12.213 bits |
+80.55 dB |
-81.17 dB |
The "*" symbol signifies the distortion metrics for that particular sample rate
are invalid due to spectral damage caused by wideband noise pulses.
The spectral performance of the Sound Blaster 16 PCI card can be reduced into
four distinct groups of common behavior. Three of the groupings are
sample rate multiples.
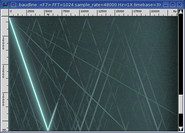
4000, 8000, 16000
There is something seriously wrong with the 4000, 8000, and 16000 sample
rates. The wideband pulses in both the matched and source
spectrogram sweeps of all three of those rates have a 2048 sample
periodicity. The -inf.000 dB THD measurement is a sign that something is
wrong. This spectral damage makes all of the distortion measurements
invalid. The sink (ADC) spectrogram sweep is free of these wideband
pulses so the problem is with the source (DAC).
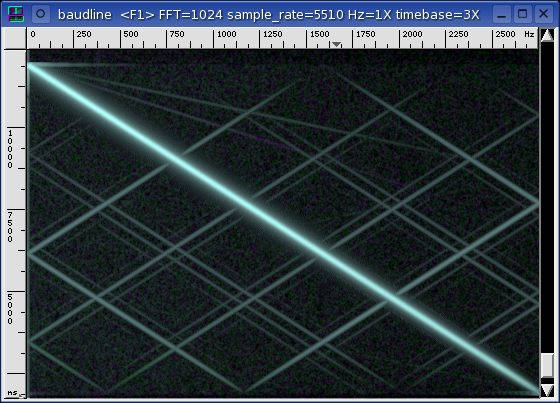
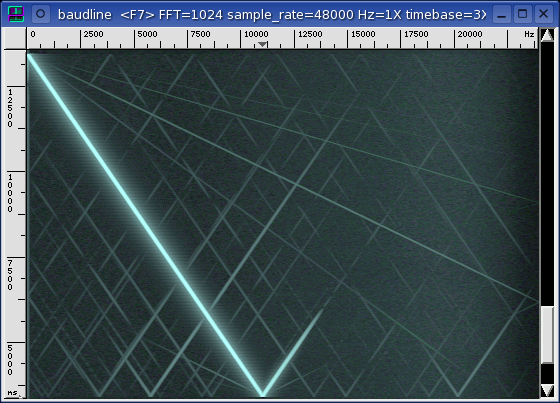
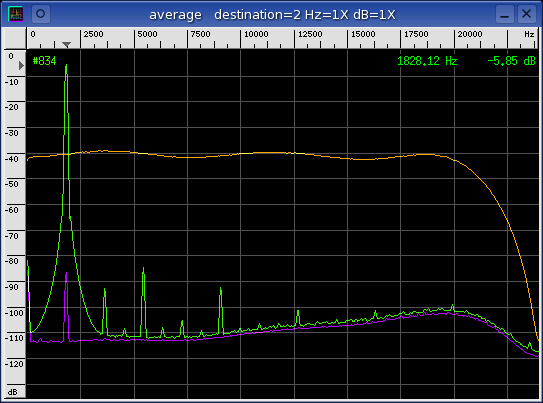
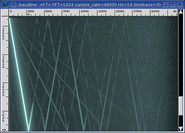
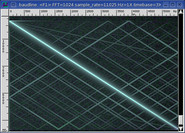
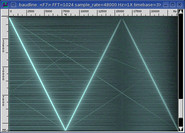
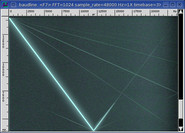
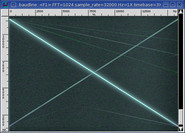
5510, 11025, 22050, 44100
The spectrogram sweep of the 5510, 11025, 22050, 44100 sample rates show strong
crosshatch aliasing distortion. The aliased harmonics are a function of
frequency and look like they are being reflected off of the spectrogram
edges. This sampling flaw hurts the ENOB measurement by a couple bits and
it indicates a decimation filter or a buffer index problem. All four
sample rates have good DAC side filters but the 5510 and 11025 rates suffer
from shallow ADC side filters. The 22050 and 44100 rates have better
signal quality than the 5510 and 11025 rates but the distortion measurements do
not accurately represent this. While the crosshatch aliasing is very
dramatic in appearance it's effect is not as bad as the folded aliasing due to
poor filter roll-off.
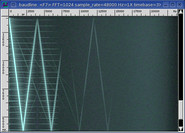
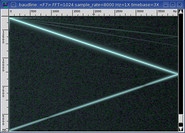
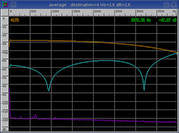
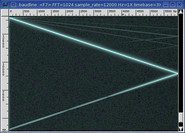
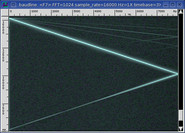
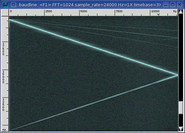
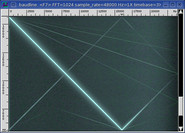
32000
The spectrogram sweep of the 32000 sample rate has a distinct symmetrical X
shape. The noise floor is very clean except for the mirror image of the
fundamental. The X pattern aliasing is stronger on the sink side likely
due to the very interesting ADC filter response shape. This a filter or
buffer index problem and it probably is related to the 48000 / 32000 = 1.5
decimation ratio.
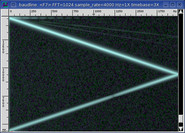
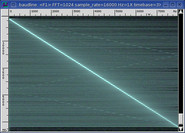
12000, 24000, 48000
The 12000, 24000, and 48000 sample rates have very clean looking spectrogram
sweeps. The harmonic distortion is very minimal and are less than the
distortion metrics portray. The sink ADC filters of the 12000 and 24000
sample rates have shallow filters and folded aliasing is a problem. The
playback performance side for all three rates is quite good.
observation
The 44100 and 48000 sample rates have almost identical distortion values yet
the 44100 spectrogram sweep suffers from folded crosshatch artifacts.
This example demonstrates the fact that a static tone doesn't not excite all of
the distortion modes. It makes the case that SNR and THD should be looked
at and plotted as function of frequency.
|
|
|
|
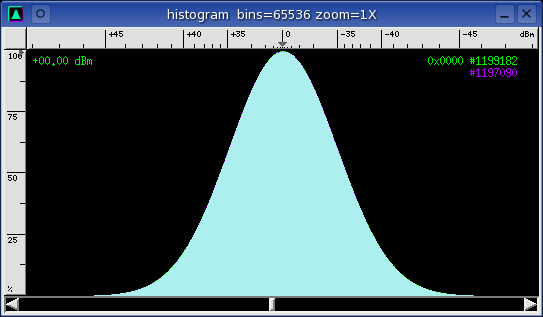
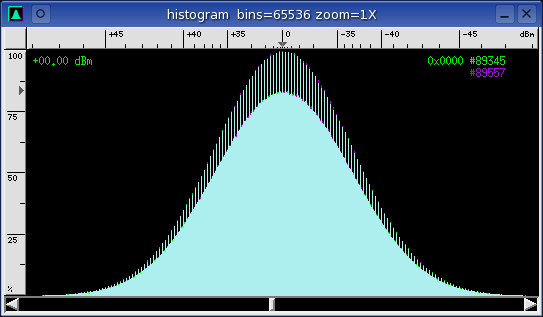
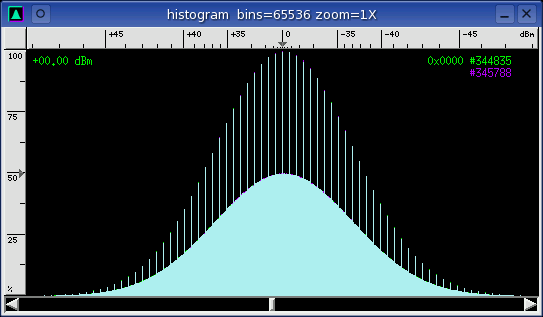
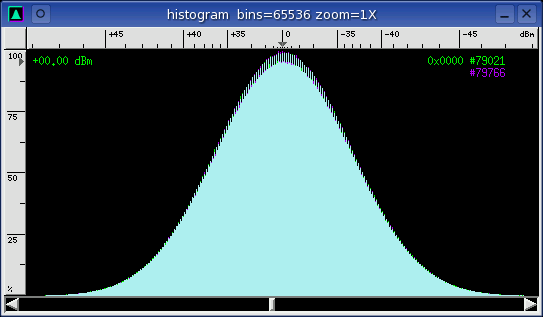
Quantization |
A white Gaussian noise signal source was generated and captured in full
duplex loopback fashion at each of the standard sample rates. The
Histogram plots below
show a unique sample distribution that is dependent on sample rate.
4000, 5510, 8000, 12000, 24000
spur cadence = { none }
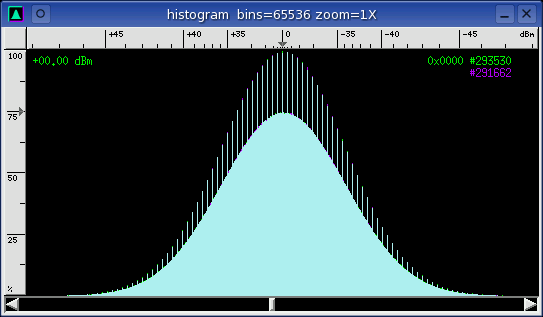
11025
spur cadence = { 1, 2, ... }
16000
spur cadence = { 1, 4, ... }
22050
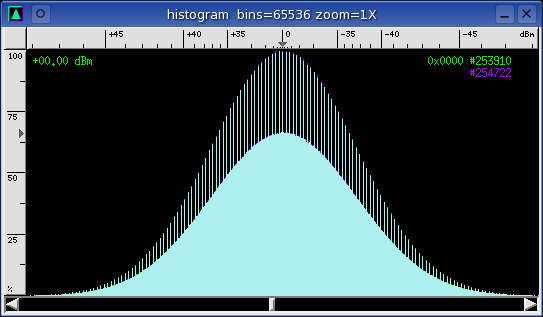
spur cadence = { 1, 3, 1, 2, ...}
32000
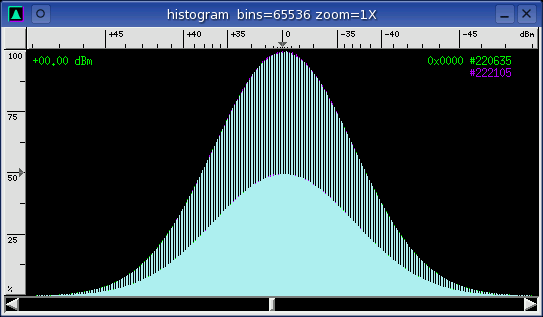
spur cadence = { 1, 1, 2, 1, ... }
44100
spur cadence = { 1, 6, ... }
48000
spur cadence = { 1, 1, ... }
Quantization errors cause spectral noise and harmonics. The relationship
between the quantization spurs and the distortion metrics will be analyzed
below. The periodicity column is calculated from the spur cadence.
The amp column is the amplitude of the spur above the base curve at the 0x0000
sample.
| rate |
spur cadence |
periodicity |
amp |
ENOB |
loop error |
| 4000 |
{ none } |
0 |
0% |
invalid |
-487.87 PPM |
| 5510 |
{ none } |
0 |
0% |
+13.832 bits |
-0.8574 PPM |
| 8000 |
{ none } |
0 |
0% |
invalid |
-487.92 PPM |
| 11025 |
{ 1, 2, ... } |
3 |
16% |
+10.357 bits |
+6.1349 PPM |
| 12000 |
{ none } |
0 |
0% |
+13.551 bits |
+0.0000 PPM |
| 16000 |
{ 1, 4, ... } |
5 |
25% |
invalid |
-488.05 PPM |
| 22050 |
{ 1, 3, 1, 2, ... } |
3, 4, and 7 |
35% |
+12.549 bits |
+8.9930 PPM |
| 24000 |
{ none } |
0 |
0% |
+13.205 bits |
+0.0000 PPM |
| 32000 |
{ 1, 1, 2, 1, ... } |
2, 3, and 5 |
50% |
+8.685 bits |
+0.9537 PPM |
| 44100 |
{ 1, 6, ... } |
7 |
50% |
+11.842 bits |
+23.0171 PPM |
| 48000 |
{ 1, 1, ... } |
2 |
5% |
+12.122 bits |
+0.0000 PPM |
There is a loose correlation at the 5510, 12000, and 24000 sample rates.
Those rates happen to have the three best ENOB measurements, no cadence spurs,
and low or zero PPM loop error values. Unfortunately this is not a
definitive result because two of the invalid ENOB measurements also have no
cadence spurs. From looking at the data it does seem clear that having a
smooth histogram coupled with a low PPM loop error helps the ENOB value.
The cause of these histogram spurs is probably due to numeric rounding
errors inside the ES1371 chipset. Either: there are not
enough mathematical bits of precision, the rounding logic is faulty, or
integer truncation is being done instead of rounding.
|
|
|
|
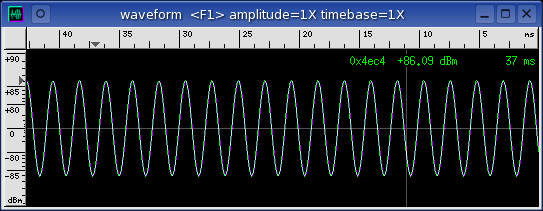
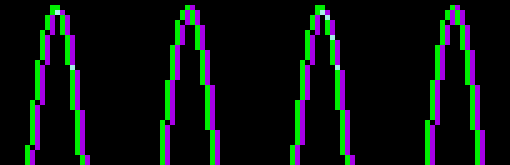
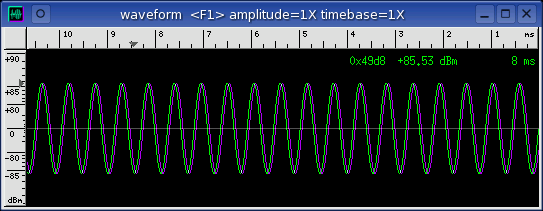
Channel Delay |
A sine wave signal was generated and captured in full duplex loopback
mode. The time domain response was observed with the
Waveform window where
the green curve represents the left channel and the purple curve represents
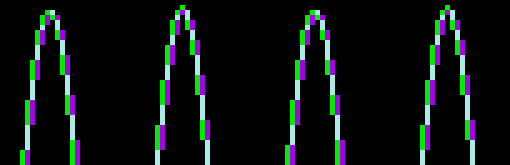
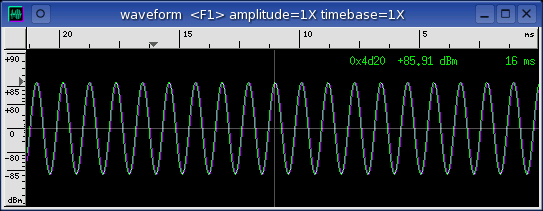
the right channel. A magnified view makes the spacing easier to
see. Three different sample delay behaviors were seen and
grouped by sample rates. The delta spacing was constant as a function
of sample rate so this phenomena is a sample delay and not a phase shift.
A half sample delay between the channels.
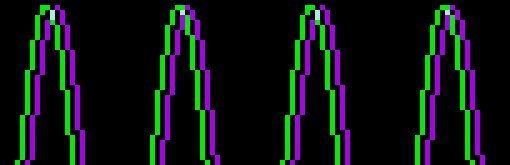
The channel delay is 1 sample.
The delay between channels is 2 samples.
This inter channel delay will cause minor timing problems with stereo
signals. Errors will be encountered while decoding
quadrature
signals for example. For the most part this delay will be imperceptible.
The cause of this extraneous delay could be due to a buffer index or a FIFO
fill problem. The different delay behavior at the three groupings has a
suspicious sample rate progression of { 12000, 24000, 48000 }. The delay
error at 48000 is likely halved at 24000 due to decimation and then again at
the 12000 rate.
Some further testing shows that the delay error is only on the sink ADC side.
|
|
|
|
Analysis |
The 4000, 8000, and 16000 sample rates suffer from severe wideband noise
bursts that cause a great deal of spectral distortion. This damage to
the spectrum invalidates all of the distortion measurements. The
periodicity helper bars
were used to make very accurate measurements of the duration between the
wideband noise pulses. For all three sample rates the period of spectral
pulse repetition works out to be 2048 samples (2^11). All three sample
rates also have a loop error measurement of approximately -488
PPM. An interesting mathematical observation is that 2048 / 2049 =
-488.04295 PPM. This looks like a 1 sample slip and it indicates a
problem with the buffer index logic. So, when using the Sound Blaster 16
PCI card it is best to avoid the 4000, 8000, and 16000 sample rates.
More than half of the sample rates with the SB16 PCI card have a unique
sample quantization signature. Histogram smoothness was seen to have a
strong influence on ENOB quality but a lack of spurs by itself is not a
guarantee of quality.
The SB16 PCI card has three different inter channel sample delay groups that
are based on the 48000 sample rate and it's division by 2 and 4. They
likely are caused by the ES1371's internal decimation circuitry and logic.
|
|
|
|
Conclusion |
Recording is clean at all of the standard sample rates but only the 16000,
22050, 44100, and 48000 rates have reasonable ADC filter rejection
curves. The higher input error PPM measurements along with the crosshatch
aliasing at 22050 and 44100 may make recording at these sample rates
undesirable.
Playback at all of the standard rates except 4000, 8000, and 16000 is fairly
clean. The strong crosshatch and X aliasing at 5510, 11025, 22050, 32000,
and 44100 may be undesirable. Only audio playback at 12000, 24000, and
48000 is recommended.
For clean full duplex recording and playback with the Sound Blaster 16 PCI card
only the 48000 sample rate is recommended.
The sample rate error at the recommended rates is +2 PPM or better. This
is extremely accurate for a sound card.
The performance of the SB16 PCI card very similar to the
Sound Blaster 128. Both cards use
the Creative Labs ES1371 chipset. The SB128 has slightly better
performance (+0.32 bits) that is likely due to a different codec chip with
slightly better 48000 filter ripple. The SB128 does not have the two
sample inter channel delay problem that the SB16 PCI suffers from.
|
|
|
|
|