|
|
|
Information |
ESS Maestro 2E
| vendor |
ESS Technology
|
| product |
Maestro 2E |
| interface |
chip on Compaq Armada M300 motherboard |
| duplex |
full |
| channels |
2 |
| resolution |
16 bits |
| max rate |
48 Ksample/sec |
| codec |
ES1978 |
| operating system |
Mandrake 9.0 Linux x86 2.4.19 |
driver |
maestro OSS 3.8.2 |
buffer size |
input 32 KB, output 32 KB |
| test date |
Sep 26 2005 |
| notes |
Only input is a mono microphone jack. No internal mixer loopback.
Machine not NTP disciplined.
Set mixer output "Volume" to maximum with an external mixer program.
|
This card is part of the Full Duplex DAQ comparison
survey.
|
|
|
|
Sample Rate |
The sample rate on DAQ cards is not a fixed absolute constant. Like time,
it fluctuates, and it is difficult to measure accurately. Sometimes there
are relationships between the input and output sample rates that can reveal
interesting details about the inner working machinery.
The following table of measurements use a technique described in the
sample rate stability application
note. The rate column is the sample rate value that the collection
hardware is programmed to. The in/out rate and in/out error
columns are absolute measurements of the ADC / DAC clock. The
loop error column uses a tone generator loopback method for a high
accuracy measurement of the relative difference between the ADC and the DAC
clocks. The three error
PPM columns are theoretically
related by the formula: "in_error - out_error = loop_error"
| rate |
in rate |
out rate |
in error |
out error |
loop error |
| 4000 |
3931.714 |
3931.718 |
-17071.5 PPM |
-17070.5 PPM |
+0.0000 PPM |
| 5510 |
5416.360 |
5416.383 |
-16994.6 PPM |
-16990.4 PPM |
+0.0000 PPM |
| 8000 |
7864.158 |
7864.179 |
-16980.2 PPM |
-16977.6 PPM |
+0.0000 PPM |
| 11025 |
10837.84 |
10837.88 |
-16976.0 PPM |
-16972.3 PPM |
+0.0000 PPM |
| 12000 |
11796.60 |
11796.64 |
-16950.0 PPM |
-16946.7 PPM |
+0.0000 PPM |
| 16000 |
15728.32 |
15728.34 |
-16980.0 PPM |
-16978.8 PPM |
+0.0000 PPM |
| 22050 |
21676.43 |
21676.46 |
-16942.0 PPM |
-16940.6 PPM |
+0.0000 PPM |
| 24000 |
23593.21 |
23593.25 |
-16949.6 PPM |
-16947.9 PPM |
+0.0000 PPM |
| 32000 |
31457.38 |
31457.48 |
-16956.9 PPM |
-16953.8 PPM |
+0.0000 PPM |
| 44100 |
43352.86 |
43352.97 |
-16942.0 PPM |
-16939.5 PPM |
+0.0000 PPM |
| 48000 |
47185.71 |
48000.94 |
-16964.4 PPM |
+19.5833 PPM |
-16991.0 PPM |
The ESS Maestro 2E has an extremely large absolute sample rate error of about
-17000 PPM. This error is consistent at all sample rates except 48000
where the out error is +19.58 PPM. Why does one rate have a very
high tolerance and all of the other rates are so wrong?
Except for 48000, all of the other sample rates have a loop error of
zero PPM. This means that the input and the output clocks are locked
together while the absolute rates have a large error.
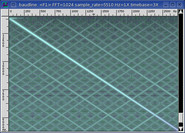
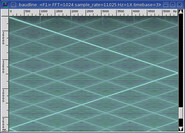
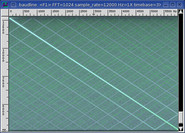
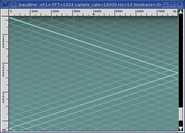
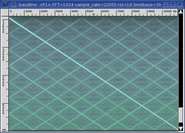
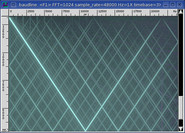
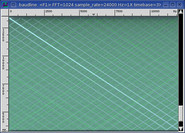
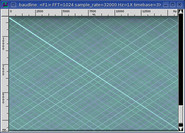
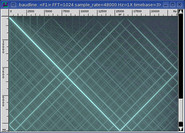
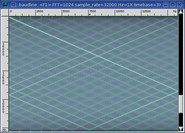
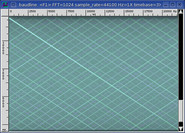
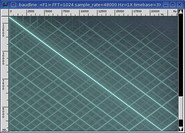
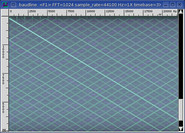
All sample rates have nice clean rate convergence plots that are smooth and
free from any discontinuities.
|
|
|
|
Frequency Domain
|
The sound card's input and output jacks are connected with a short external
cable and run in full duplex mode. This is a loopback test and baudline's
tone generator is the signal source. Distortion, noise floor, filter
response, and inter channel crosstalk are the frequency domain measurements of
interest in this section.
The signal test sources are a pure sine wave, a linear sine sweep, and
WGN. The sine wave is
used for the distortions and crosstalk measurements. The linear sine
sweep and WGN are used for the filter characterization measurement.
Both are an application of the
swept sine vs. WGN technique
and are equivalent measures of the frequency response.
Since spectral performance is a function of sample rate, each of the sound
card's native rates will be tested. The highest sample rate is usually
the cleanest and this is advantageous because it allows the isolated testing
of the ADC and the
DAC. The matched,
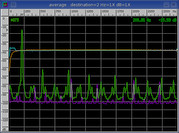
source, and sink sample rate combinations are described below.
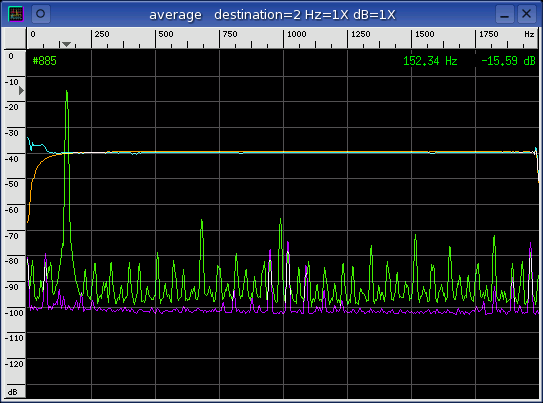
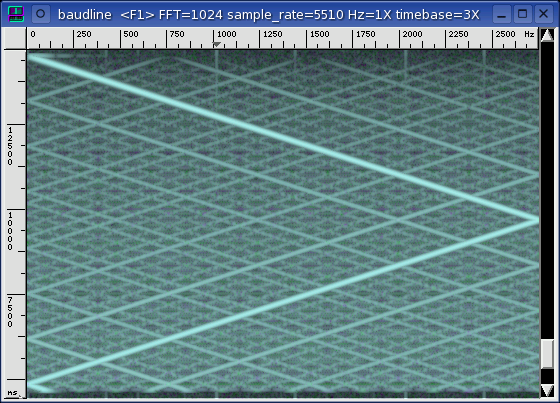
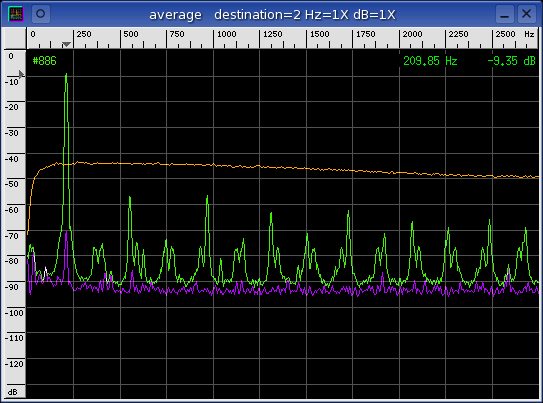
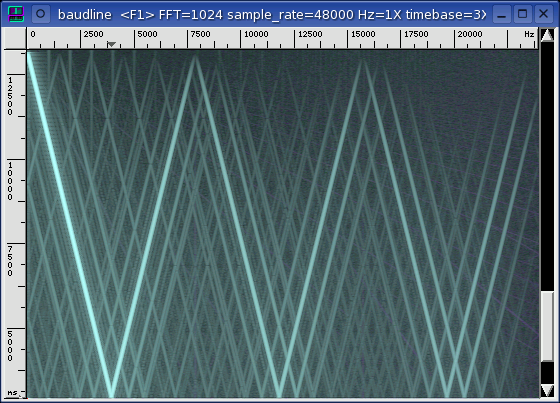
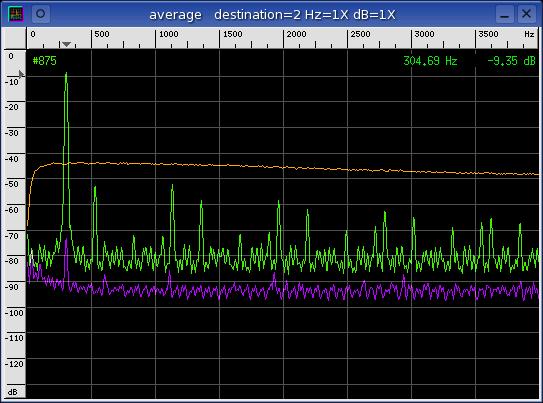
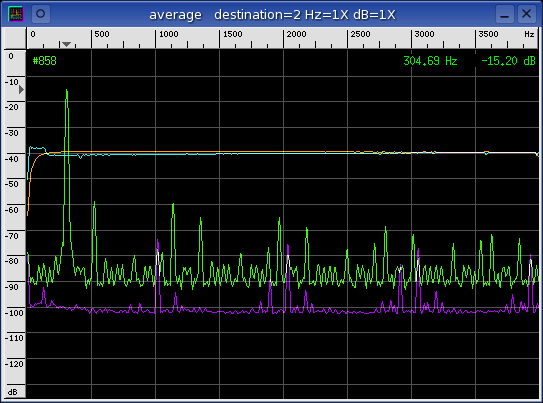
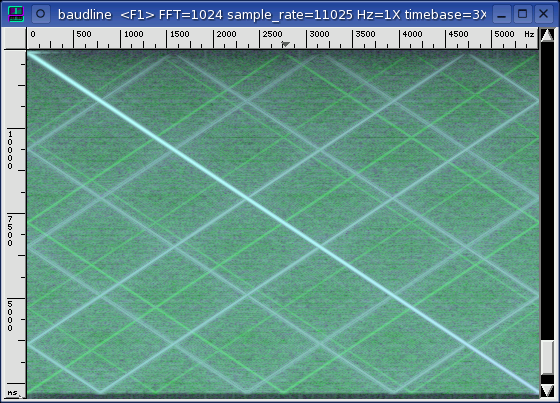
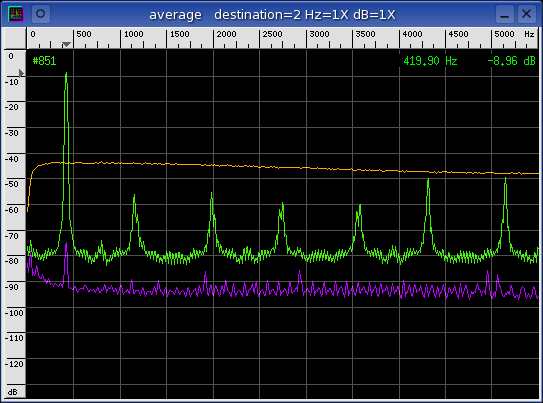
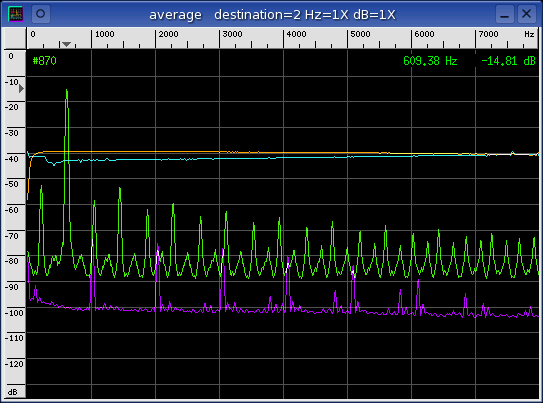
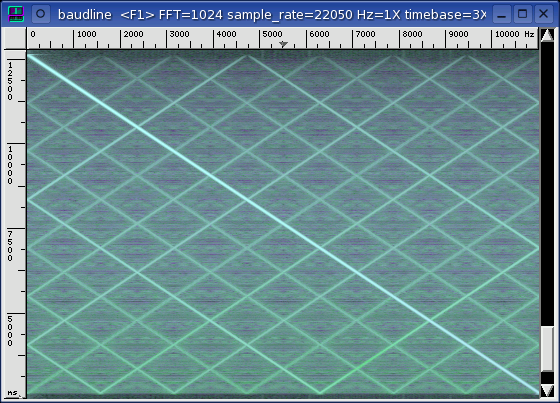
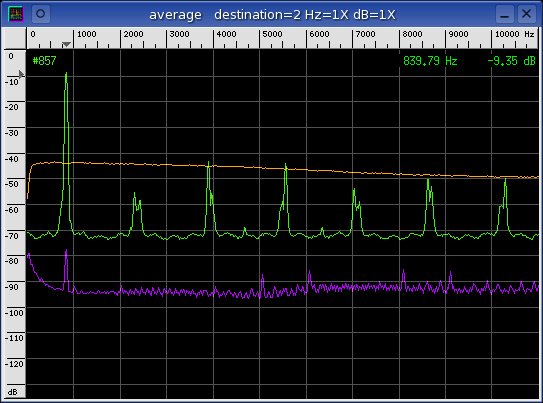
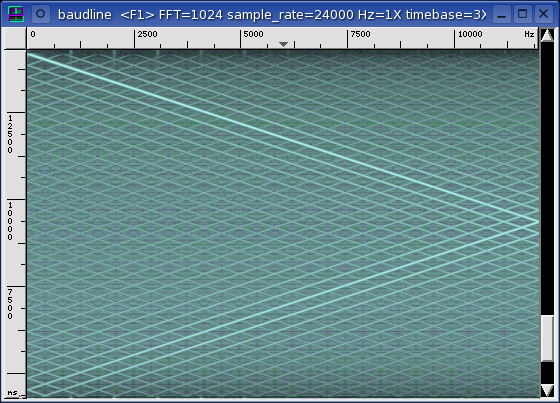
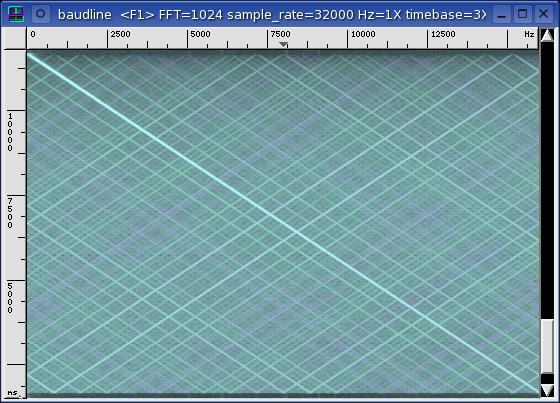
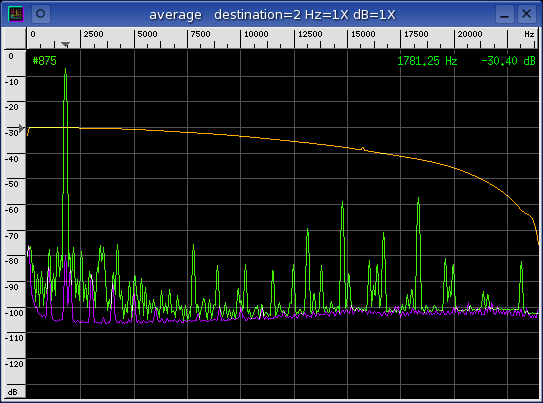
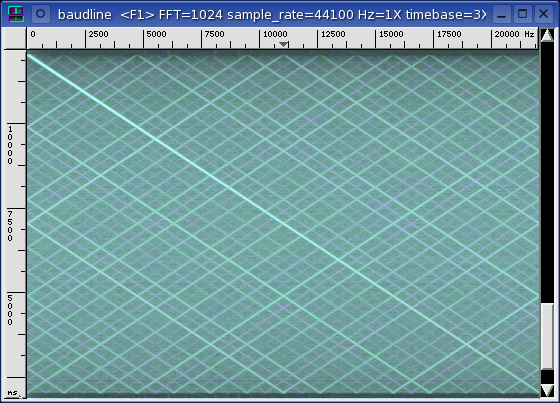
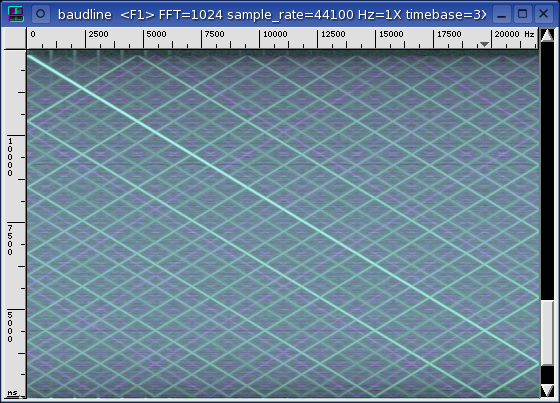
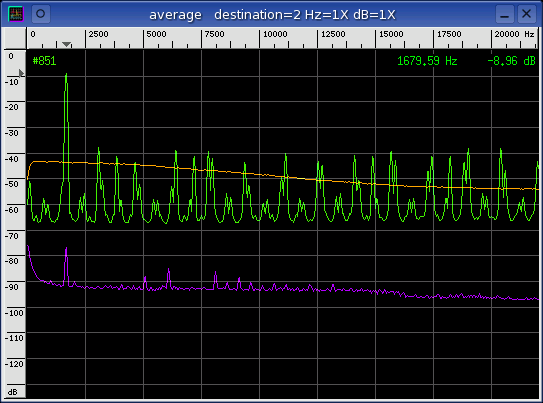
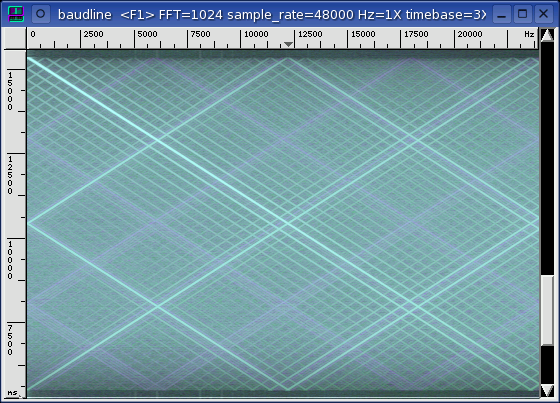
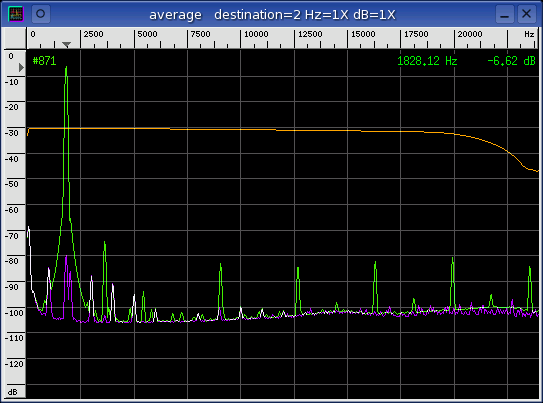
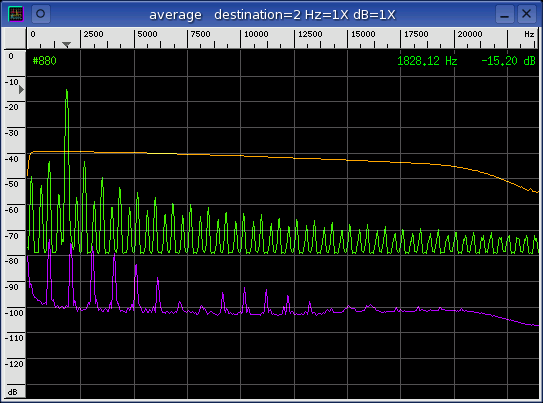
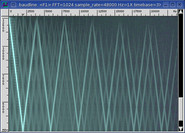
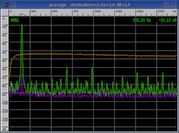
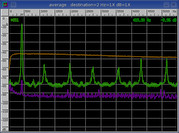
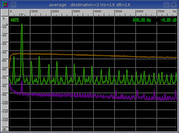
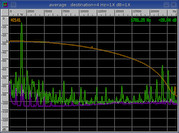
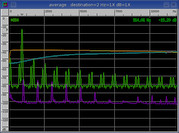
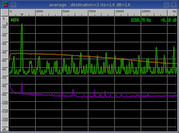
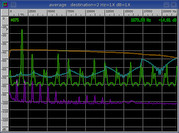
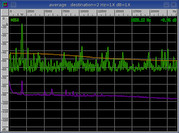
matched
The input and output sample rates are the same. This combination tests
the performance of both the ADC and the DAC in a matched mode of
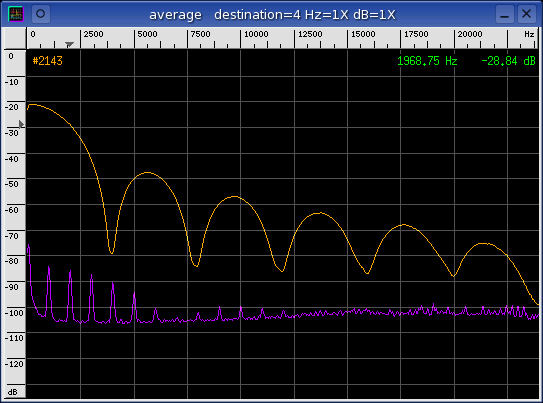
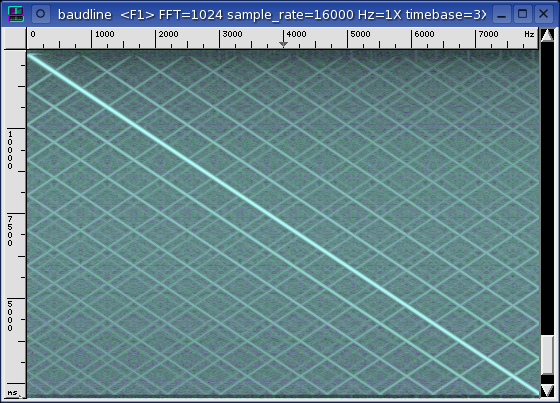
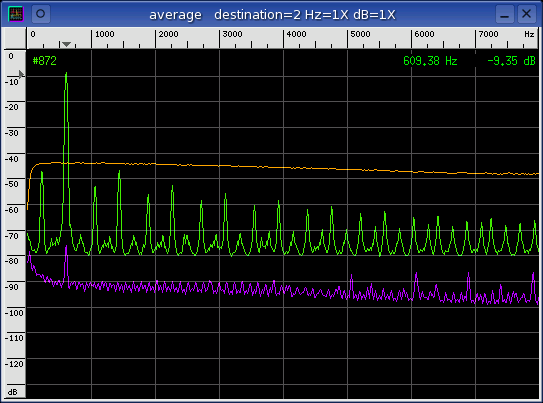
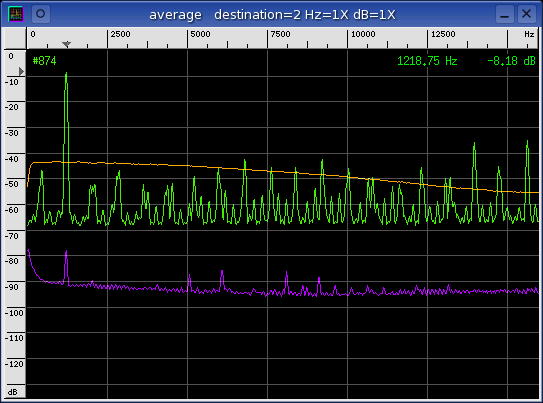
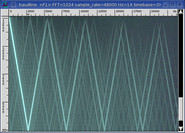
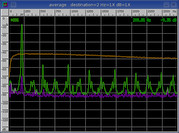
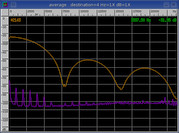
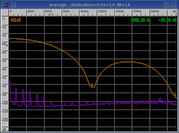
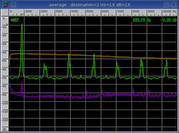
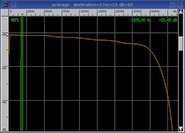
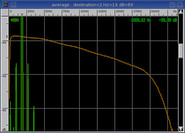
operation. The linear sine sweep signal in the left spectrogram display
and the WGN (orange) in the Average window characterize the in-band filter
response. The sine wave (green) in the Average window is used for
distortion and crosstalk measurements. The sine leakage (purple) is used
for crosstalk measurement
The matched spectral runs were so poor at all sample rates that an
iMic v3.00 was inserted into the test
chain. The iMic v3.00 has very good ADC and DAC stages and it is an ideal
tool to further investigate what is going wrong with the ESS Maestro 2E.
The iMic v3.00 was used as the source and the sink as an accurate control.
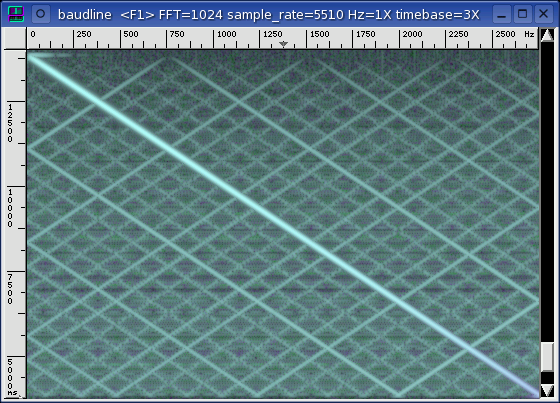
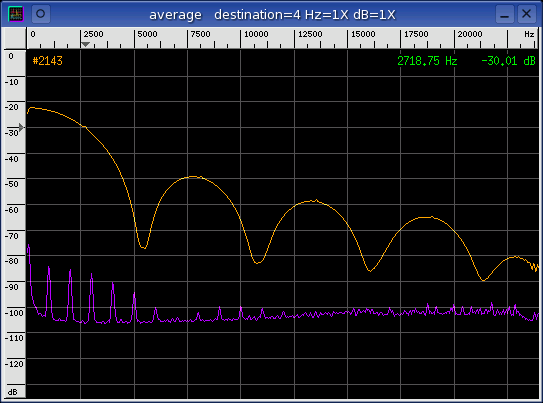
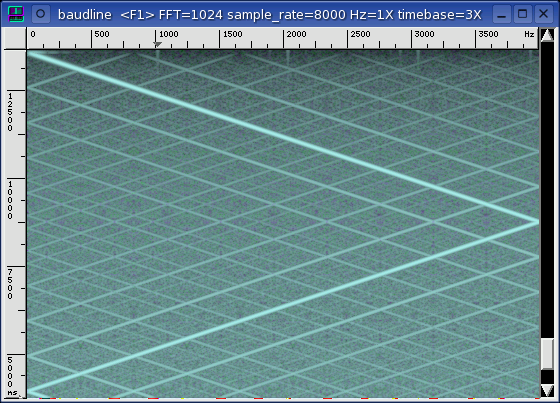
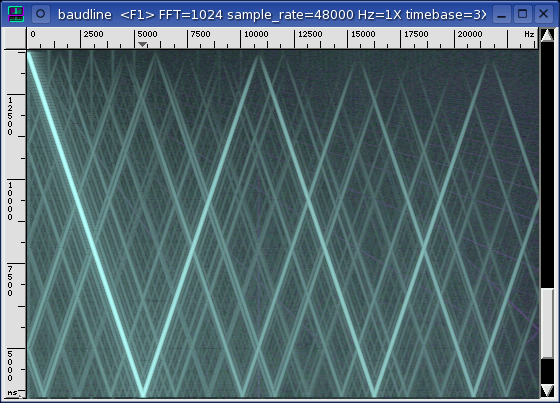
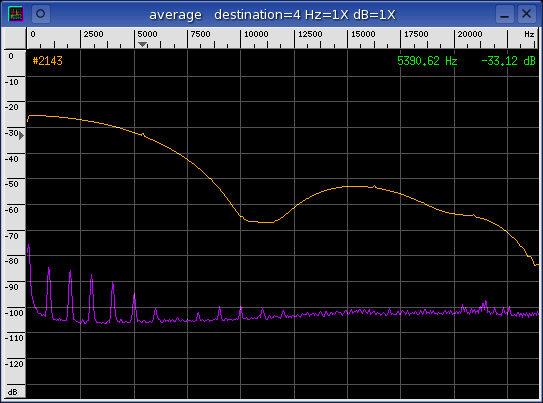
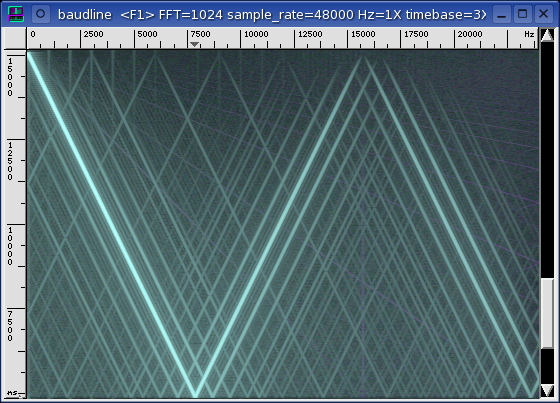
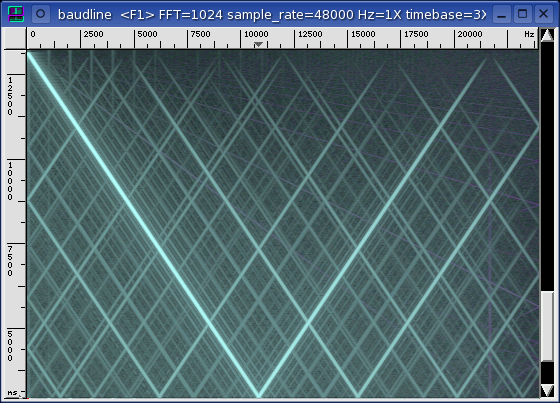
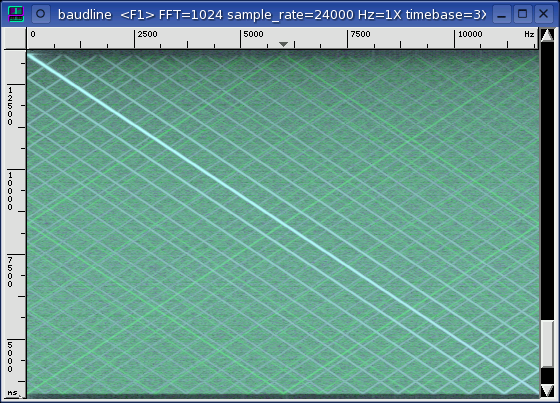
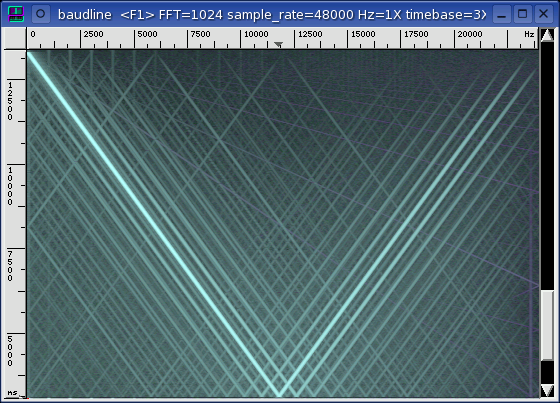
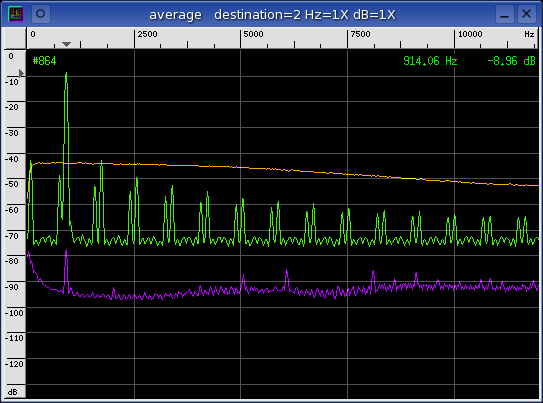
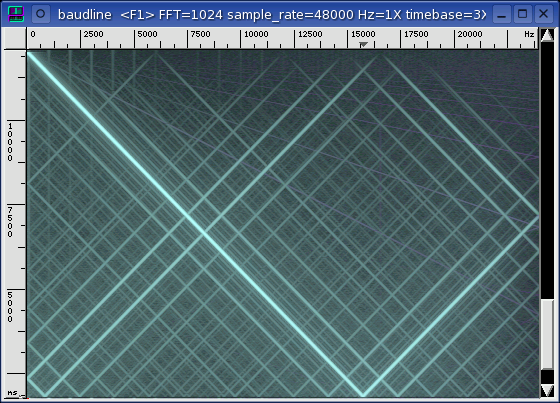
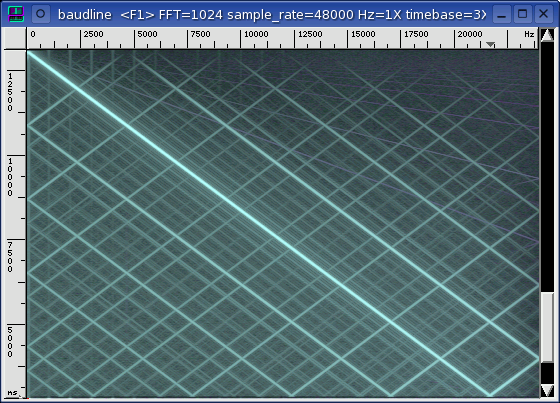
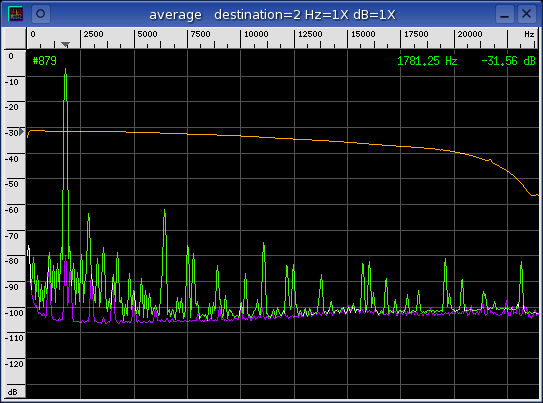
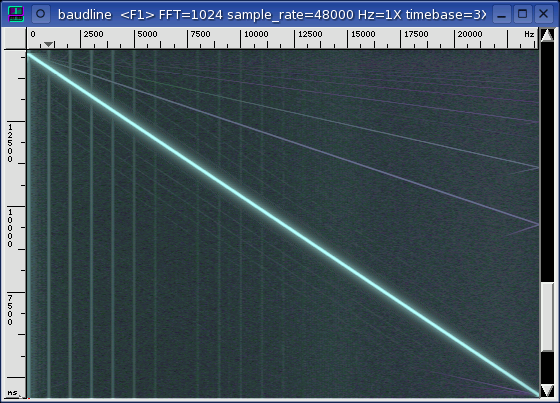
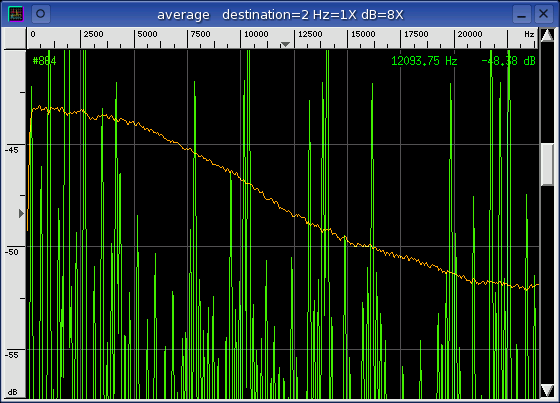
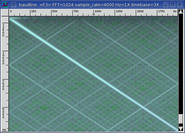
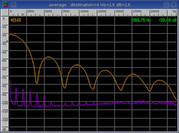
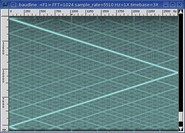
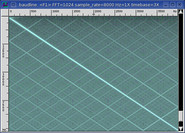
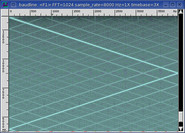
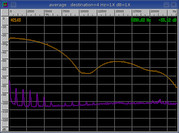
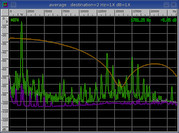
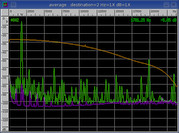
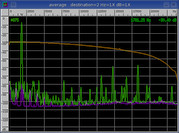
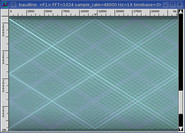
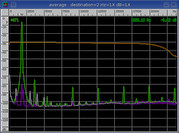
source
The iMic v3.00 at the 48000 sample rate was used for test signal capture
purposes. The Maestro 2E is the source while the iMic is the sink.
This combination tests the performance of the Maestro 2E's DAC. The
linear sine sweep signal in the middle spectrogram display characterizes the
DAC filter response. The position of the pass-band and the stop-band
filter transition is defined by the Nyquist frequency of the DAC. The
noise floor (purple) is either the Average collection of a silent channel or
the crosstalk channel depending on sample rate.
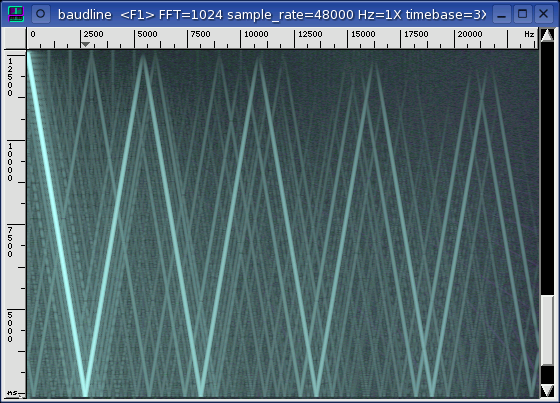
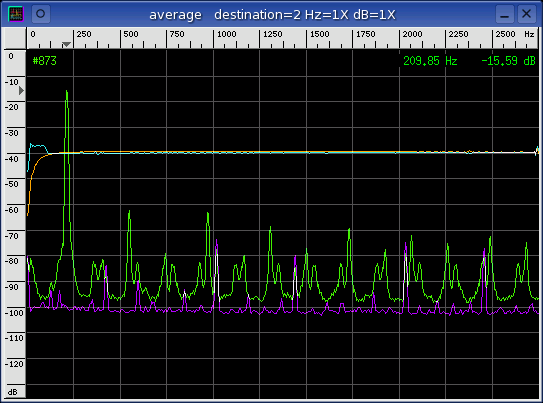
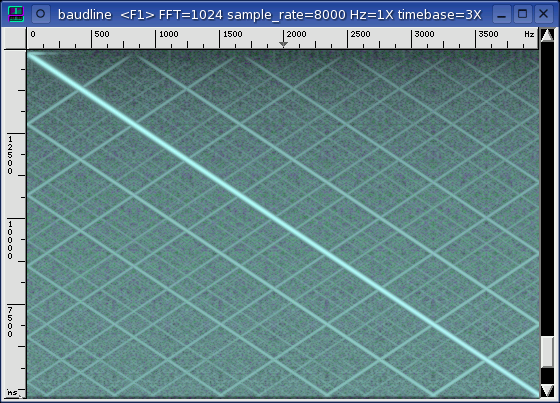
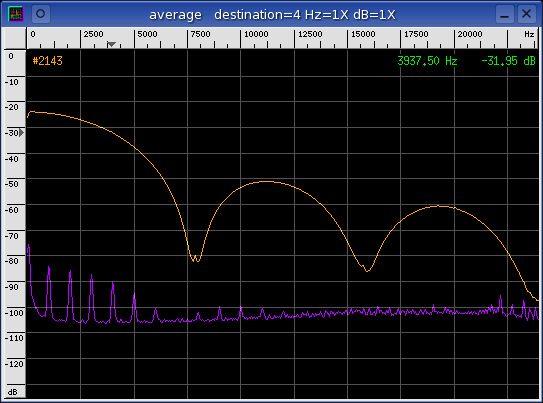
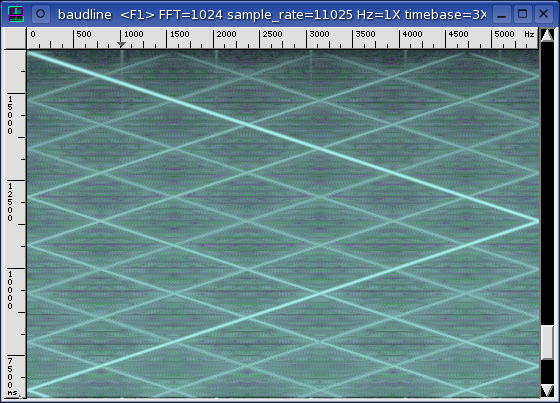
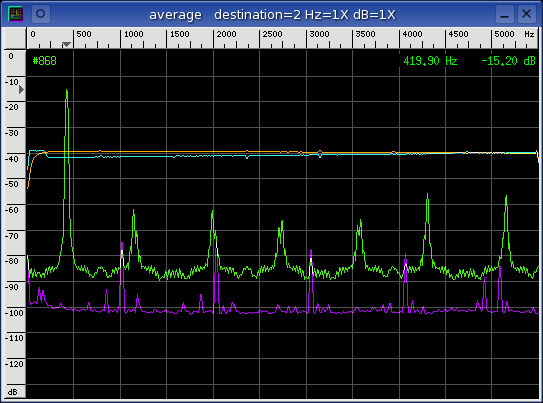
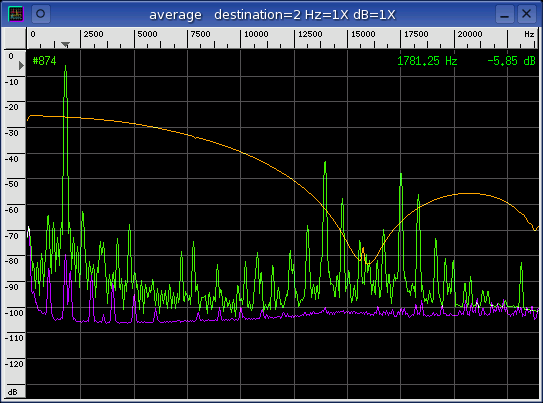
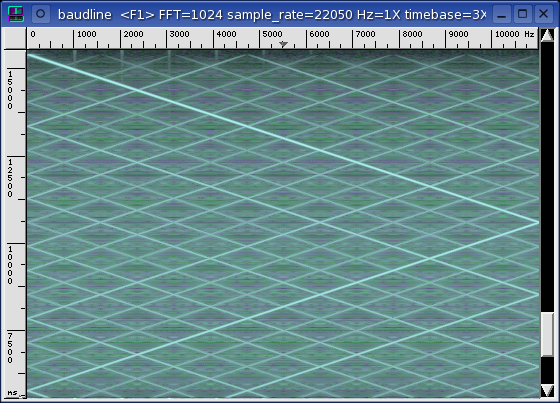
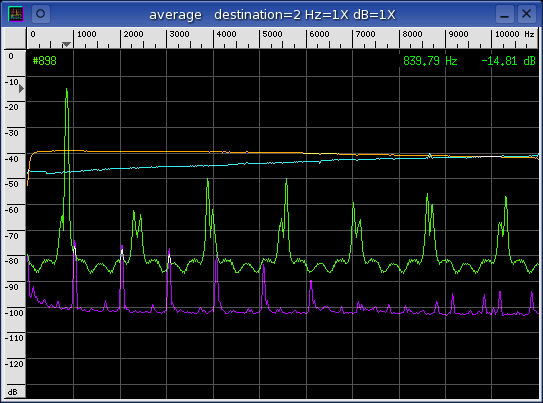
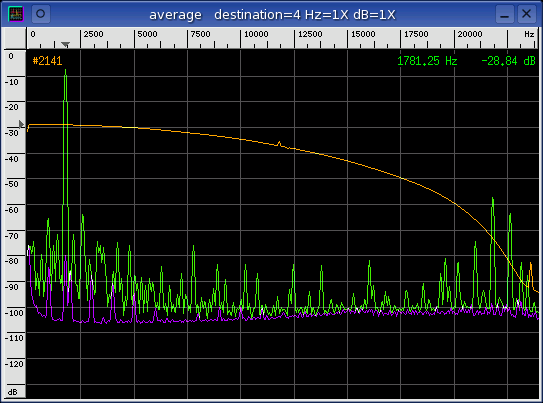
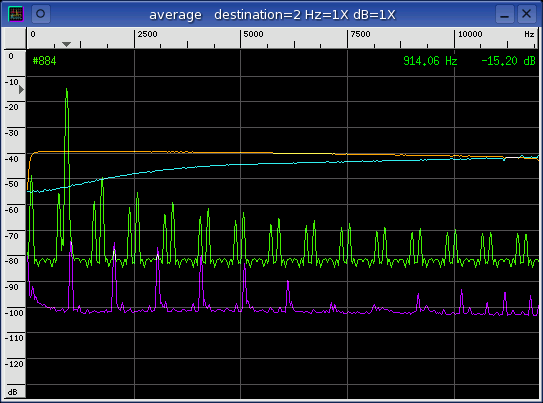
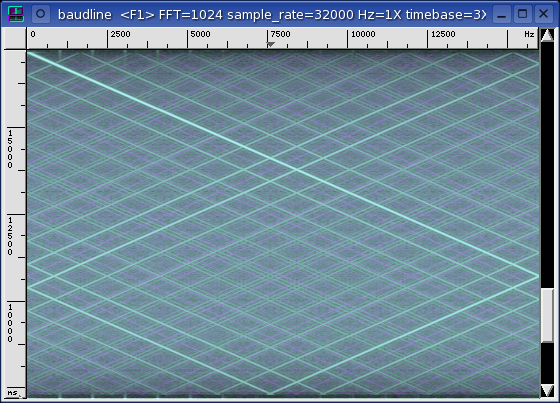
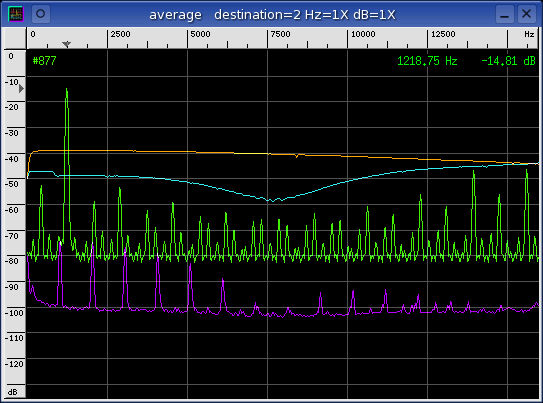
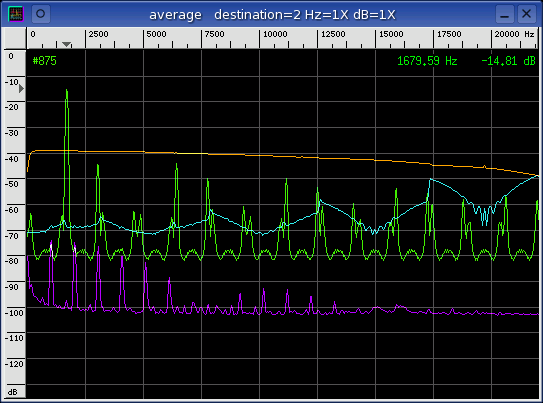
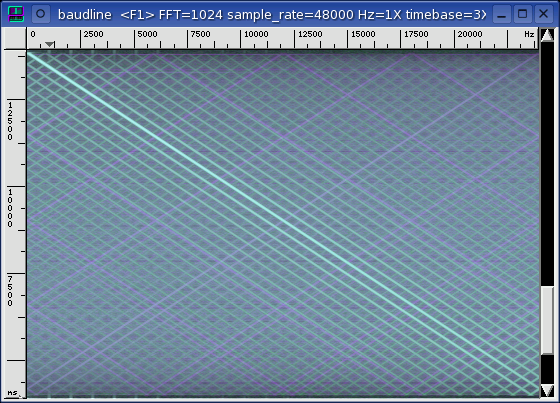
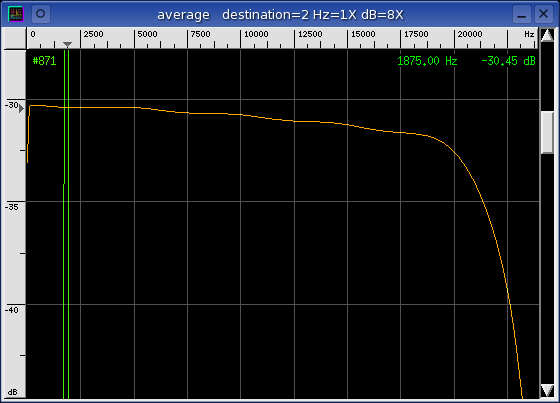
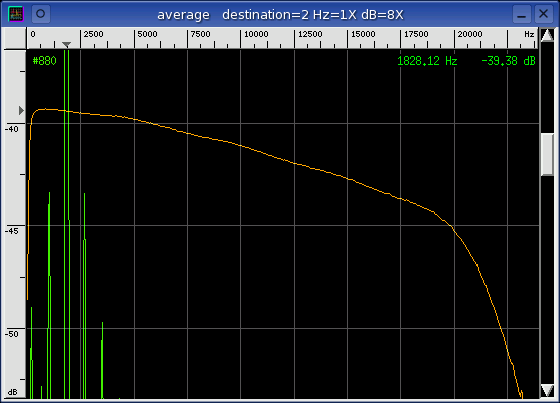
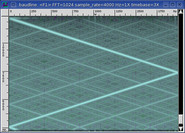
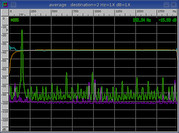
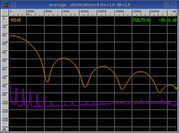
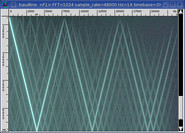
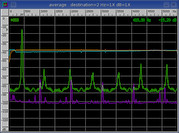
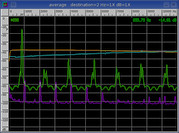
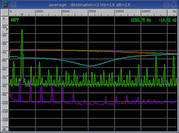
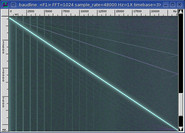
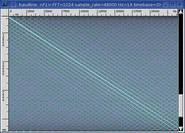
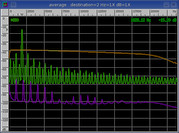
sink
The iMic v3.00 at the 48000 sample rate was used for test signal
generation. The iMic is the source while the Maestro 2E is the
sink. This combination tests the performance of the Maestro 2E's
ADC. The linear sine sweep signal in the rightmost spectrogram display
and the orange curve in the Average window below it characterize the ADC
filter response. The position of both the pass-band and the stop-band
filter transition is defined by time in the spectrogram and by folded frequency
in the Average window. The orange Average curve represents the pass-band
while the cyan curve is a folded representation of the stop-band ADC filter
response. The noise floor (purple) is the crosstalk channel.
The naming convention for the columns below is (DAC -> ADC) where DAC
represents the source sample rate and ADC represents the sink sample
rate.
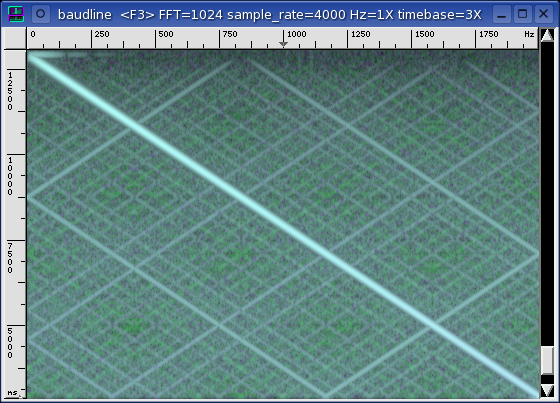
matched
|
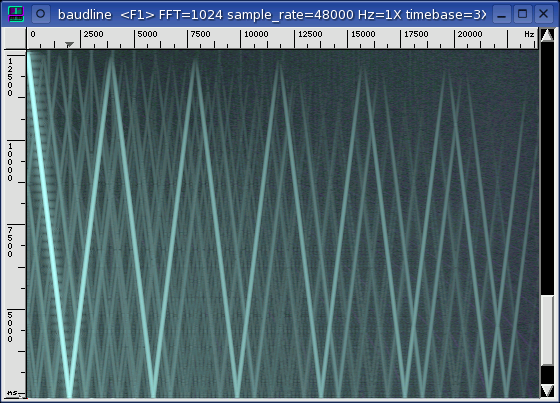
source (DAC)
|
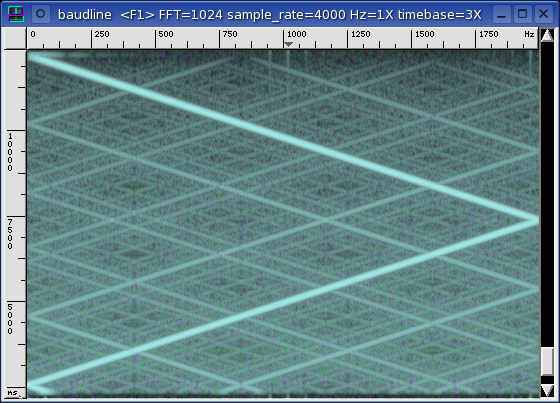
sink (ADC)
|
|
4000 -> 4000
|
4000 -> 48000
|
48000 -> 4000
|
|
|
|
|
|
|
|
5510 -> 5510
|
5510 -> 48000
|
48000 -> 5510
|
|
|
|
|
|
|
|
8000 -> 8000
|
8000 -> 48000
|
48000 -> 8000
|
|
|
|

|
|
|
|
11025 -> 11025
|
11025 -> 48000
|
48000 -> 11025
|
|
|
|
|
|
|
|
12000 -> 12000
|
12000 -> 48000
|
48000 -> 12000
|
|
|
|
|
|
|
|
16000 -> 16000
|
16000 -> 48000
|
48000 -> 16000
|
|
|
|
|
|

|
|
22050 -> 22050
|
22050 -> 48000
|
48000 -> 22050
|
|
|

|
|
|
|
|
24000 -> 24000
|
24000 -> 48000
|
48000 -> 24000
|
|
|
|

|
|
|
|
32000 -> 32000
|
32000 -> 48000
|
48000 -> 32000
|
|
|
|
|
|
|
|
44100 -> 44100
|
44100 -> 48000
|
48000 -> 44100
|
|
|
|
|
|
|
|
48000 -> 48000
|
48000 -> 48000
|
48000 -> 48000
|
|
|
|
|
|
|

|
|
|
|
|
|
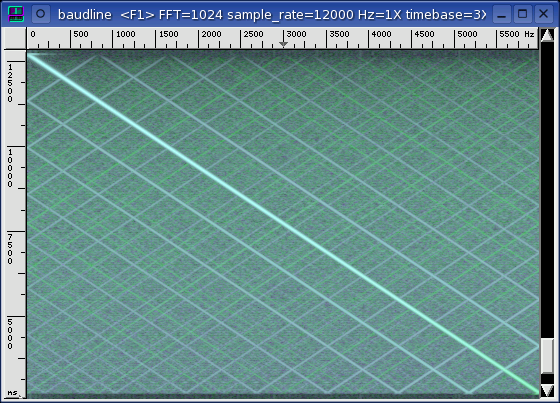
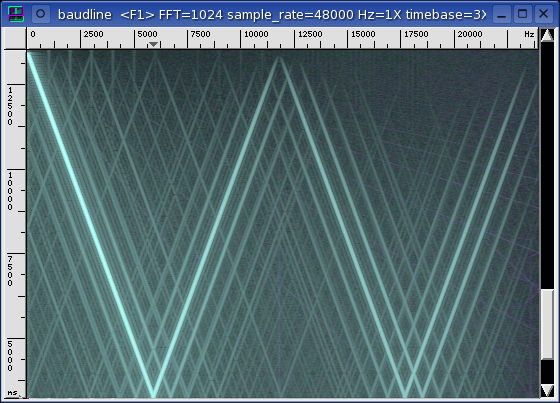
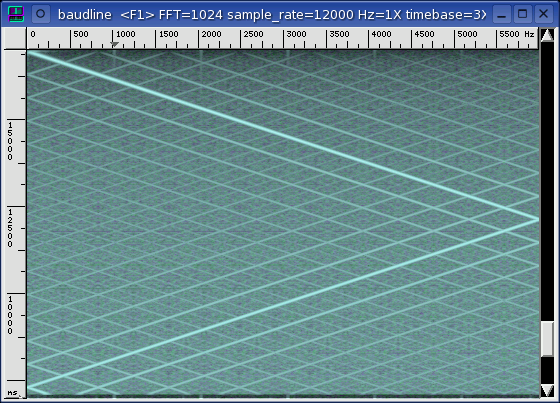
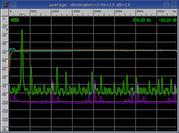
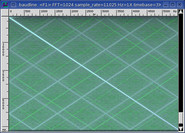
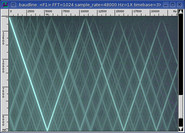
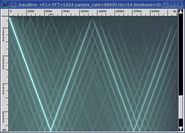
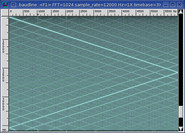
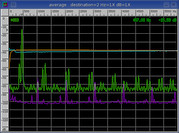
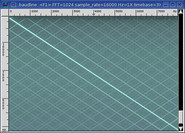
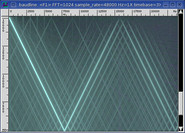
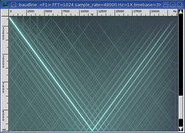
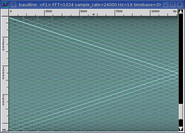
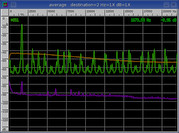
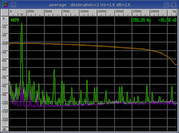
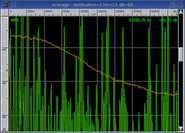
Severe crosshatch aliasing is seen at all sample rates in the matched
column. The source spectrogram sweep at 48000 is very clean. The
DAC filter have 25 dB stop-band attenuation at the lower rates. The ADC
anti-aliasing filter is nonexistent at all sample rate except for 32000 and
44100 were it is extremely poor.
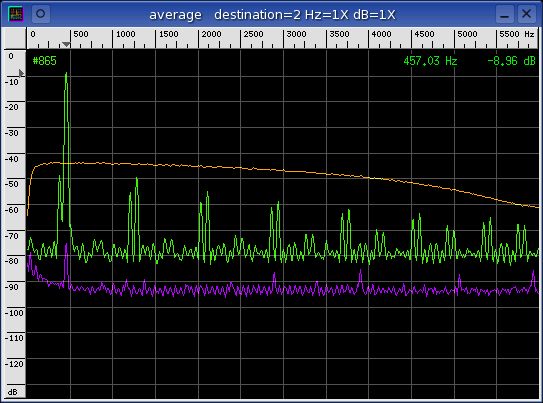
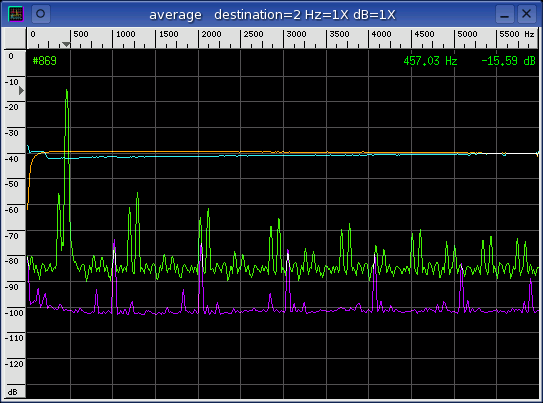
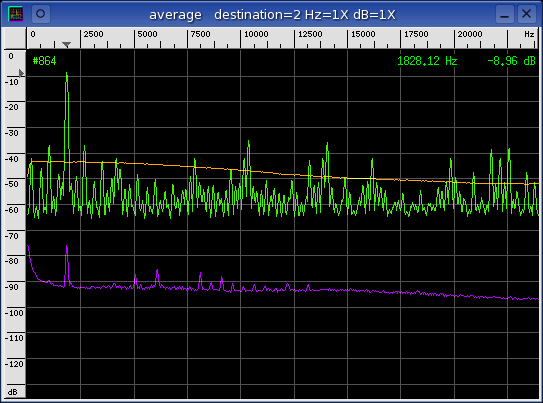
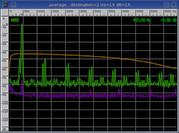
Notice the strong 1000 Hz tone and it's harmonics in the noise floor (purple)
curves of the source and sink columns. They are artifacts from the iMic
and can also be seen on the iMic v3.00 page.

distortion matched
The following table of measurements were made using the technique described in
the sine distortion application
note. It is a full duplex test that uses a loopback of the tone generator
to measure the various distortion parameters. The stereo crosstalk
column is a measure of channel leakage that uses a sine wave channel and a
silent channel as the signal sources.
| rate |
SNR |
THD |
SINAD |
ENOB |
SFDR |
crosstalk |
|
| 4000 |
+46.01 dB |
-52.58 dB |
+45.14 dB |
+7.206 bits |
+50.74 dB |
-59.09 dB |
| 5510 |
+42.70 dB |
-52.92 dB |
+42.30 dB |
+6.734 bits |
+47.59 dB |
-61.50 dB |
| 8000 |
+39.08 dB |
-50.22 dB |
+38.76 dB |
+6.145 bits |
+43.98 dB |
-64.29 dB |
| 11025 |
+36.19 dB |
-54.00 dB |
+36.12 dB |
+5.707 bits |
+41.15 dB |
-65.68 dB |
| 12000 |
+35.58 dB |
-50.45 dB |
+35.44 dB |
+5.594 bits |
+40.68 dB |
-66.30 dB |
| 16000 |
+33.10 dB |
-48.55 dB |
+32.98 dB |
+5.185 bits |
+38.47 dB |
-67.10 dB |
| 22050 |
+30.05 dB |
-47.36 dB |
+29.97 dB |
+4.685 bits |
+34.85 dB |
-68.39 dB |
| 24000 |
+29.50 dB |
-46.24 dB |
+29.41 dB |
+4.592 bits |
+34.41 dB |
-68.55 dB |
| 32000 |
+22.65 dB |
-26.10 dB |
+21.04 dB |
+3.201 bits |
+26.98 dB |
-68.55 dB |
| 44100 |
+18.49 dB |
-30.94 dB |
+18.25 dB |
+2.739 bits |
+29.05 dB |
-67.50 dB |
| 48000 |
+17.70 dB |
-30.52 dB |
+17.48 dB |
+2.611 bits |
+25.62 dB |
-66.47 dB |
distortion source(DAC)
The same distortion measurement technique as above but the iMic v3.00 was used
in the sink position. This table represents the distortion created by the
ESS Maestro 2E's DAC.
| rate |
SNR |
THD |
SINAD |
ENOB |
SFDR |
crosstalk |
|
| 16000 |
+34.81 dB |
-63.33 dB |
+34.80 dB |
+5.488 bits |
+36.46 dB |
-73.54 dB |
| 22050 |
+43.01 dB |
-63.27 dB |
+42.97 dB |
+6.845 bits |
+43.97 dB |
-73.64 dB |
| 24000 |
+46.83 dB |
-64.25 dB |
+46.75 dB |
+7.473 bits |
+49.45 dB |
-72.72 dB |
| 32000 |
+47.30 dB |
-64.85 dB |
+47.23 dB |
+7.552 bits |
+50.13 dB |
-72.75 dB |
| 44100 |
+51.79 dB |
-65.14 dB |
+51.60 dB |
+8.277 bits |
+54.78 dB |
-72.79 dB |
| 48000 |
+71.92 dB |
-65.77 dB |
+64.83 dB |
+10.475 bits |
+68.58 dB |
-73.64 dB |

distortion sink(ADC)
The same distortion measurement technique as above but the iMic v3.00 was used
in the source position. This table represents the distortion created by
the ESS Maestro 2E's ADC.
| rate |
SNR |
THD |
SINAD |
ENOB |
SFDR |
|
| 4000 |
+44.66 dB |
-59.73 dB |
+44.53 dB |
+7.103 bits |
+50.15 dB |
| 5510 |
+42.02 dB |
-58.83 dB |
+41.93 dB |
+6.673 bits |
+47.28 dB |
| 8000 |
+38.85 dB |
-56.67 dB |
+38.78 dB |
+6.148 bits |
+43.97 dB |
| 11025 |
+36.15 dB |
-54.25 dB |
+36.09 dB |
+5.702 bits |
+40.96 dB |
| 12000 |
+35.45 dB |
-49.57 dB |
+35.29 dB |
+5.568 bits |
+40.59 dB |
| 16000 |
+33.15 dB |
-44.14 dB |
+32.82 dB |
+5.158 bits |
+37.88 dB |
| 22050 |
+30.21 dB |
-47.26 dB |
+30.13 dB |
+4.712 bits |
+35.02 dB |
| 24000 |
+29.36 dB |
-48.34 dB |
+29.30 dB |
+4.574 bits |
+34.31 dB |
| 32000 |
+27.24 dB |
-37.00 dB |
+26.80 dB |
+4.159 bits |
+31.75 dB |
| 44100 |
+24.12 dB |
-41.03 dB |
+24.04 dB |
+3.700 bits |
+29.47 dB |
| 48000 |
+23.36 dB |
-40.56 dB |
+23.28 dB |
+3.574 bits |
+28.12 dB |
The matched and sink(ADC) distortion performance of the Maestro 2E card is
horrible. This is caused by the lack of ADC filters on the Maestro
2E. Since the ADC filters are the limiting factor, The matched and the
sink runs have very similar distortion measurements. It is also
interesting the SNR, THD, SINAD, ENOB, and SFDR all steadily improve as the
sample rate decreases. From 48000 to 4000 the ENOB improves by 4.6 bits.
The source(DAC) distortion performance of the Maestro 2E at the 48000 sample
rate is fairly good and it is tolerable at the 44100. The source
distortion measurements degrade in quality as the sample rate decreases.
|
|
|
|
Quantization |
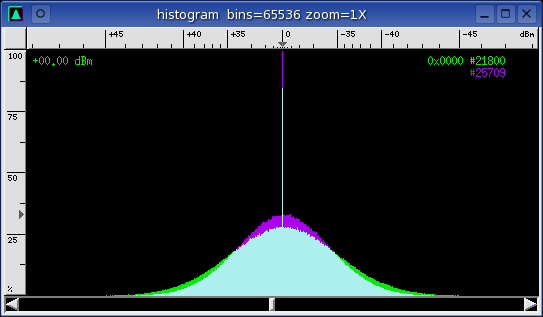
A white Gaussian noise signal source was generated and captured in full
duplex loopback fashion at each of the standard sample rates. The
Histogram plots below
show a unique sample distribution that is dependent on sample rate.
4000 ... 12000
The 4000 to 12000 samples are a variation of the above histogram. The
left and right channels alternate as the most prominent which is cause by a
slight gain mismatch.
16000 ... 48000
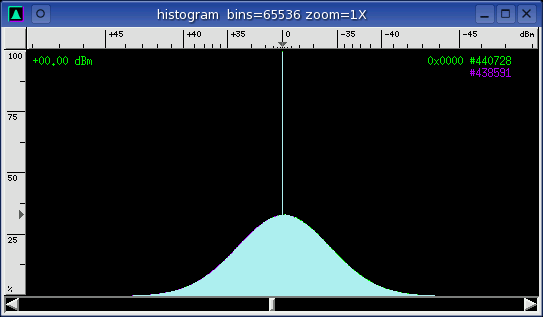
All sample rates greater than 12000 look like the above histogram. The
strong DC spike is a round to zero error and it has a height of 66%.
The 3:1 percentage would fit the rounding rule of truncation, that is, values
between -1. and +1 go to zero.
|
|
|
|
Channel Delay |
A sine wave signal was generated and captured in full duplex loopback
mode. The time domain response was observed with the
Waveform window where
the green curve represents the left channel and the purple curve represents
the right channel.
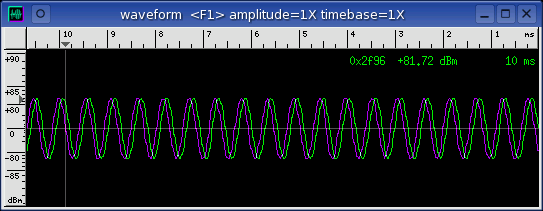
This is a 3 or 4 sample inter channel delay. The delay becomes less as
the sample rate decreases. Below the 32000 sample rate the delay is about
one sample.
This phenomena is not a function of frequency so it is a delay and not a phase
shift.
|
|
|
|
Analysis |
The ES1978 has a -17000 PPM rate error at almost every sample rate, massive
harmonic distortion, nonexistent filters, extremely poor distortion
measurements, a DC quantization spike at bin zero, and a couple sample inter
channel delay.
This chip has a lot of problems it is looks like they are all related.
|
|
|
|
Conclusion |
The performance of the ESS Maestro 2E chip is horrible except for DAC operation
at the 48000 sample rate.
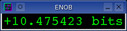
For playback at 48000 the ENOB is +10.475 bits and the sample rate error is
+19.5833 PPM. The Maestro 2E's DAC performance at 48000 is fairly good.
Unfortunately playback at 48000 is the only good thing about the Maestro
2E.
DAC playback at 44100 is tolerable with an ENOB of +8.277 bits but the output
sample rate error is -16939.5 PPM. Such a large sample rate error will
drastically change the tuning of MP3 music playback. A440 would become
A432.5 which is -30 cents (third of a semitone).
The ADC anti-alias filters are nonexistent on the Maestro 2E so recording is
not recommended.
|
|
|
|
|