|
|
|
Information |
Cirrus Logic CS4236B
| vendor |
Cirrus Logic
|
| product |
Crystal CS4236B |
| interface |
chip on Intel SE440BX motherboard |
| duplex |
full |
| channels |
2 |
| resolution |
16 bits |
| max rate |
48 Ksample/sec |
| chipset |
CS4611 |
| codec |
CS4236B |
| operating system |
Mandrake 10.1 Linux x86 2.6.8.1 |
driver |
cs4236 ALSA 1.0.6 |
buffer size |
input 64 KB, output 64 KB |
| test date |
Sep 12 2005 |
| notes |
CS4236B at 0x534, irq 5, dma 1&3
include /etc/isapnp.conf
Set the Tone Generator's digital gain to -1 dB for 2.3 bits more of ENOB.
|
This card is part of the Full Duplex DAQ comparison
survey.
|
|
|
|
Sample Rate |
The sample rate on DAQ cards is not a fixed absolute constant. Like time,
it fluctuates, and it is difficult to measure accurately. Sometimes there
are relationships between the input and output sample rates that can reveal
interesting details about the inner working machinery.
The following table of measurements use a technique described in the
sample rate stability application
note. The rate column is the sample rate value that the collection
hardware is programmed to. The in/out rate and in/out error
columns are absolute measurements of the ADC / DAC clock. The
loop error column uses a tone generator loopback method for a high
accuracy measurement of the relative difference between the ADC and the DAC
clocks. The three error
PPM columns are theoretically
related by the formula: "in_error - out_error = loop_error"
| rate |
in rate |
out rate |
in error |
out error |
loop error |
|
| 4000 |
4009.123 |
4009.132 |
+2280.75 PPM |
+2283.00 PPM |
+31.6196 PPM |
* |
| 5510 |
5512.549 |
5512.561 |
+462.613 PPM |
+464.791 PPM |
+0.0000 PPM |
| 8000 |
7999.320 |
7999.331 |
-85.0000 PPM |
-83.6250 PPM |
+0.0000 PPM |
| 11025 |
11025.106 |
11025.114 |
+9.6145 PPM |
+10.3401 PPM |
+0.0000 PPM |
| 12000 |
12027.392 |
12027.398 |
+2282.67 PPM |
+2283.17 PPM |
+0.0000 PPM |
| 16000 |
16006.212 |
16006.222 |
+388.250 PPM |
+388.875 PPM |
+0.0000 PPM |
| 22050 |
22050.236 |
22050.249 |
+10.7029 PPM |
+11.2925 PPM |
+0.0000 PPM |
| 24000 |
24054.812 |
24054.824 |
+2283.83 PPM |
+2284.33 PPM |
+0.0000 PPM |
| 32000 |
32012.448 |
32012.475 |
+389.000 PPM |
+389.844 PPM |
+0.0000 PPM |
| 44100 |
44100.510 |
44100.527 |
+11.5646 PPM |
+11.9501 PPM |
+0.0000 PPM |
| 48000 |
47972.865 |
47973.211 |
-565.313 PPM |
-558.104 PPM |
+0.0000 PPM |
The "*" signifies a very noisy spectrum which probably makes the
loop error measurement invalid. Only the 4000 sample rate has
this problem.
The CS4236B is amazing in that the loop error measurement is +0.0000 PPM
for all of the sample rates except 4000. This means that the ADC and DAC
clocks are locked and all of the DSP sample rate conversions retain this
ratio. This is backed up by the observation that for every sample rate
the in error is approximately equal to the out error.
It appears that 44100 is the native rate for the clock and all of the other
rates are derived from that. There are some interesting
in/out error groupings by sample rate. The 4000, 12000, and 24000
sample rates have absolute errors of +2283 PPM. The 16000 and 32000
sample rates have absolute errors of +389 PPM. The 11025, 22050, 44100
sample rates have absolute errors of +11 PPM. The following rates are odd
balls in that they match no groupings { 5510 8000 48000 }. Not sure what
the significance of the non matching rates is other than a different clock
division strategy/formula/constants being at work.
It is interesting that the measured rate for 5510 is 5512.5 which exactly
half of 11025.
|
|
|
|
Frequency Domain
|
The sound card's input and output jacks are connected with a short external
cable and run in full duplex mode. This is a loopback test and baudline's
tone generator is the signal source. Distortion, noise floor, filter
response, and inter channel crosstalk are the frequency domain measurements of
interest in this section.
The signal test sources are a pure sine wave, a linear sine sweep, and
WGN. The sine wave is
used for the distortions and crosstalk measurements. The linear sine
sweep and WGN are used for the filter characterization measurement.
Both are an application of the
swept sine vs. WGN technique
and are equivalent measures of the frequency response.
Since spectral performance is a function of sample rate, each of the sound
card's native rates will be tested. The highest sample rate is usually
the cleanest and this is advantageous because it allows the isolated testing
of the ADC and the
DAC. The matched,
source, and sink sample rate combinations are described below.
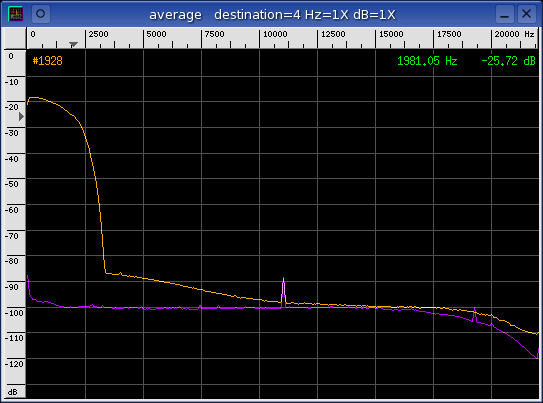
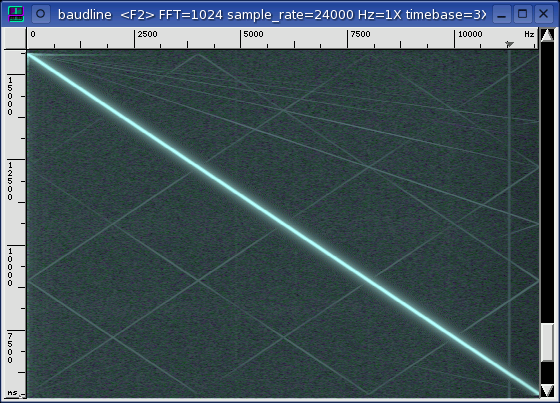
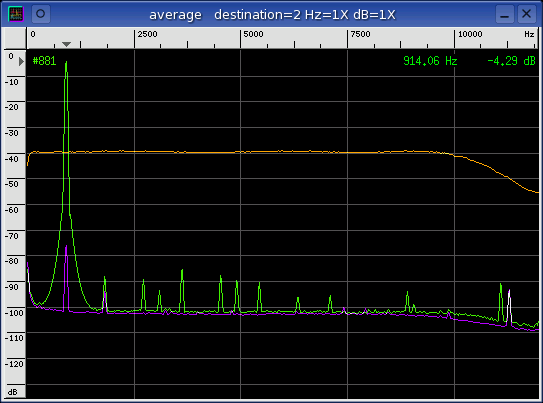
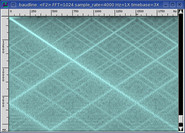
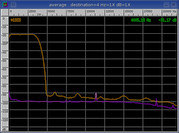
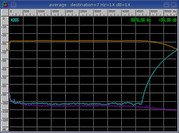
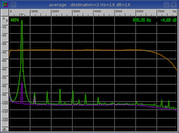
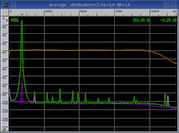
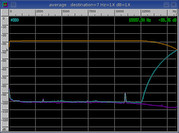
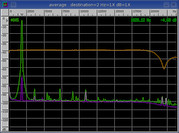
matched
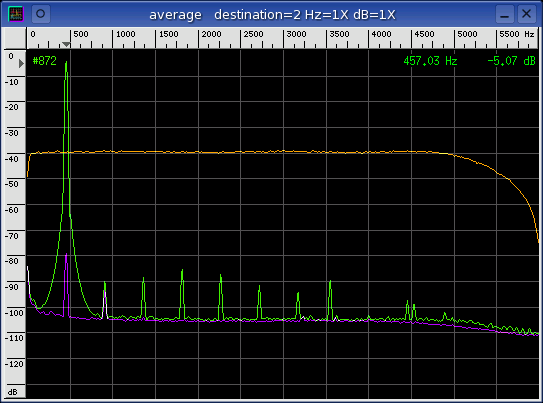
The input and output sample rates are the same. This combination tests
the performance of both the ADC and the DAC in a matched mode of
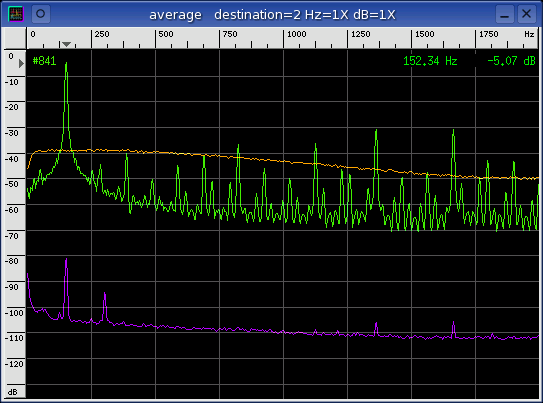
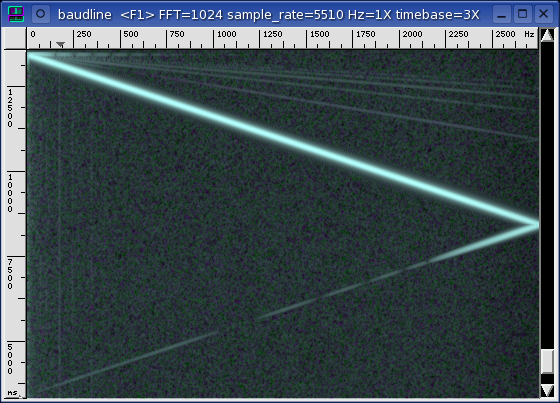
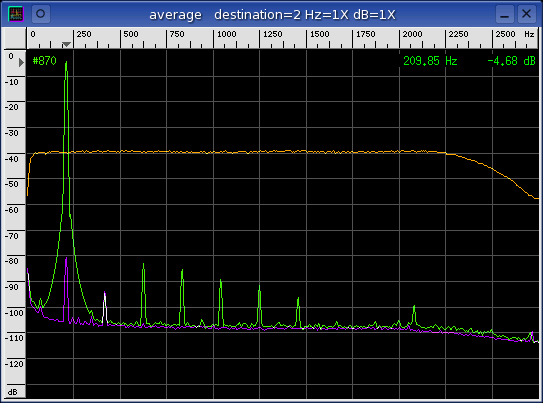
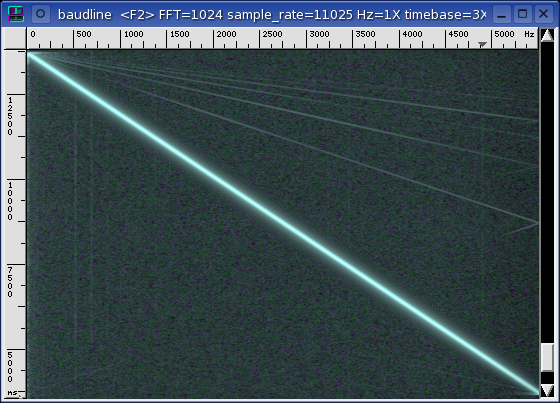
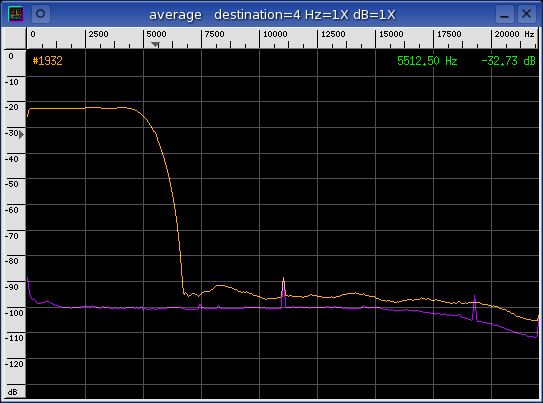
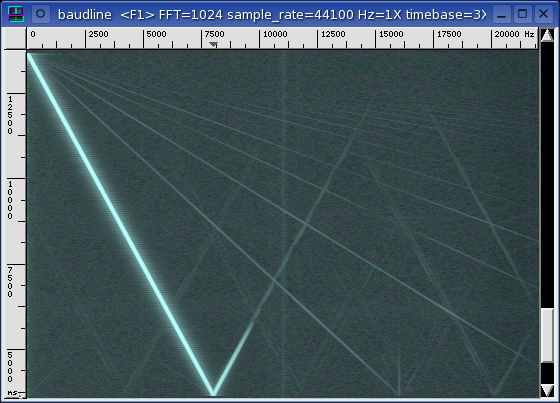
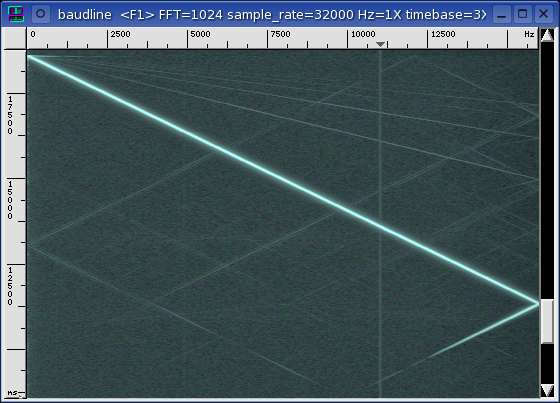
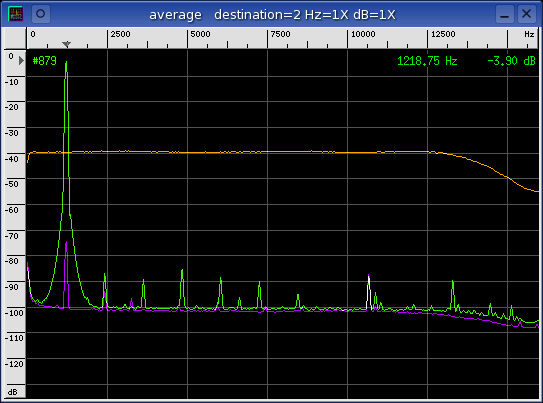
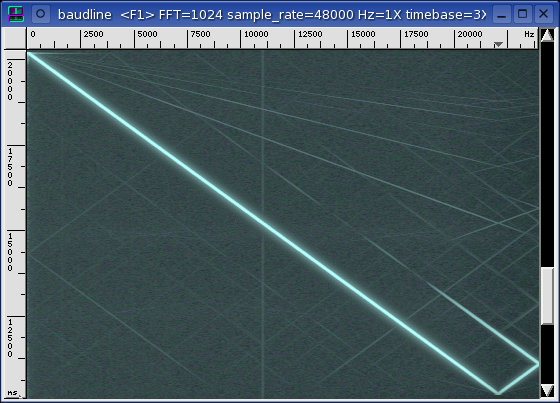
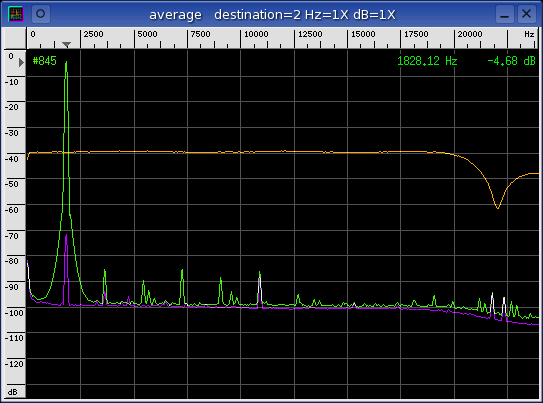
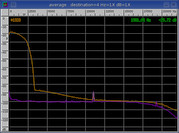
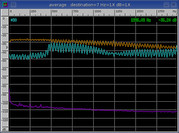
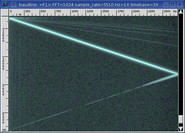
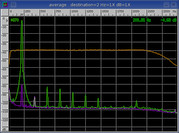
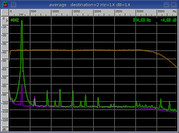
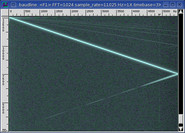
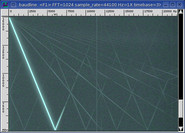
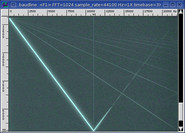
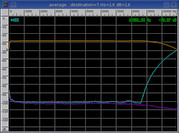
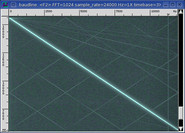
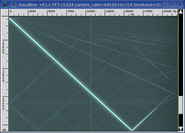
operation. The linear sine sweep signal in the left spectrogram display
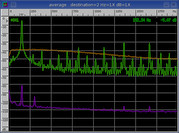
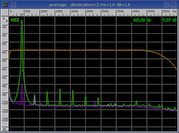
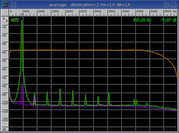
and the WGN (orange) in the Average window characterize the in-band filter
response. The sine wave (green) in the Average window is used for
distortion and crosstalk measurements. The sine leakage (purple) is used
for crosstalk measurement
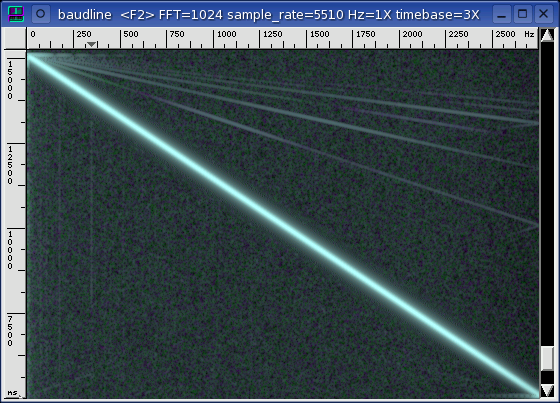
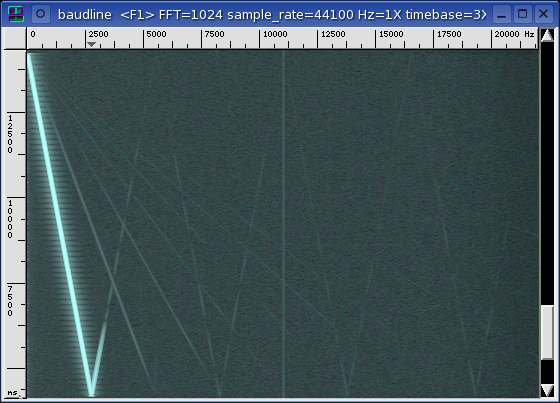
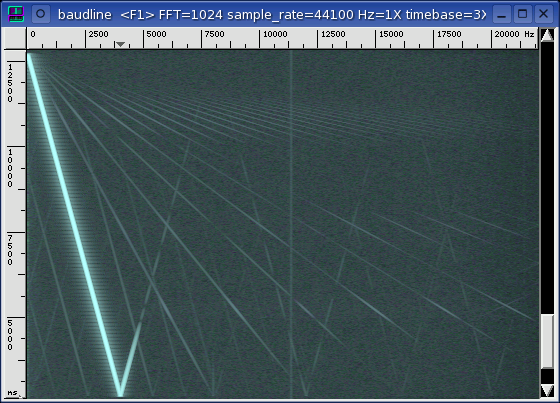
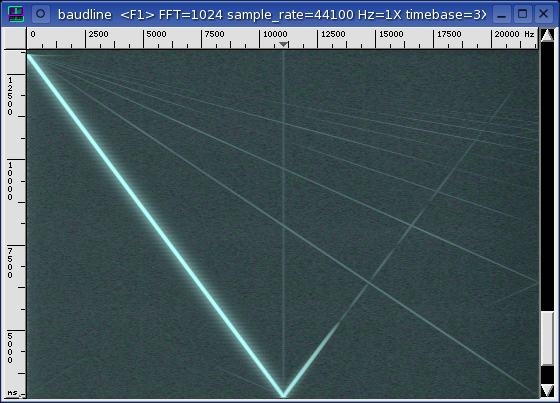
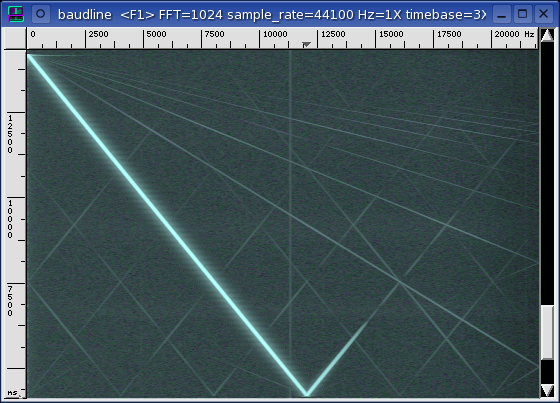
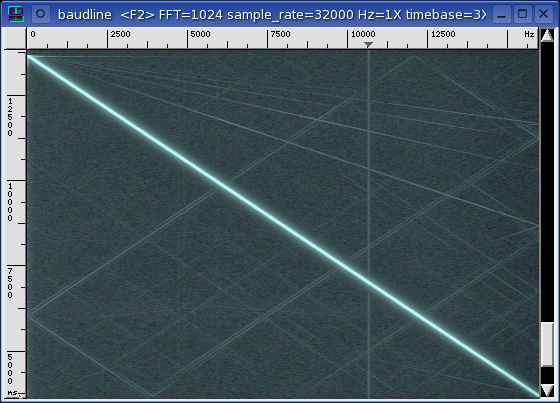
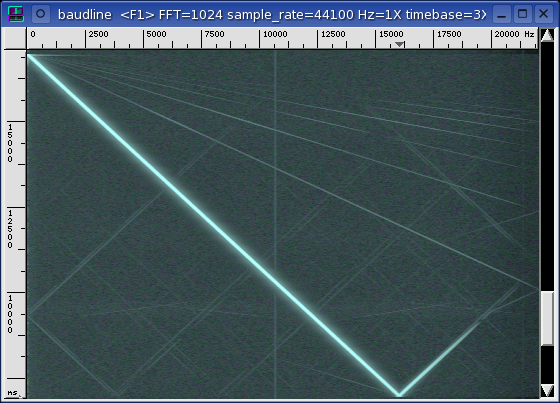
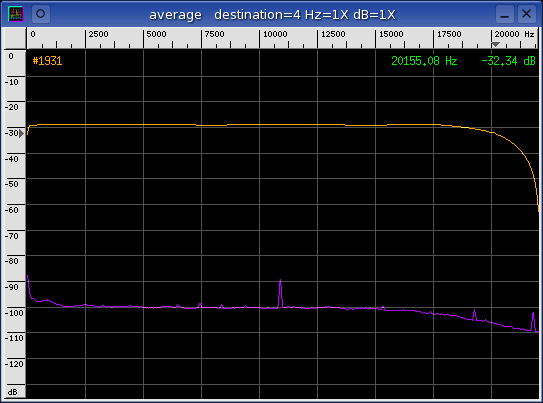
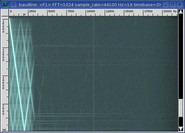
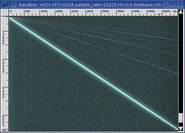
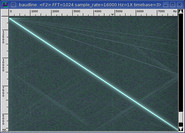
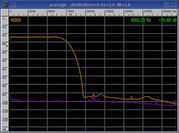
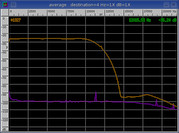
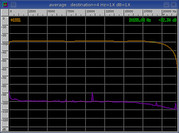
source
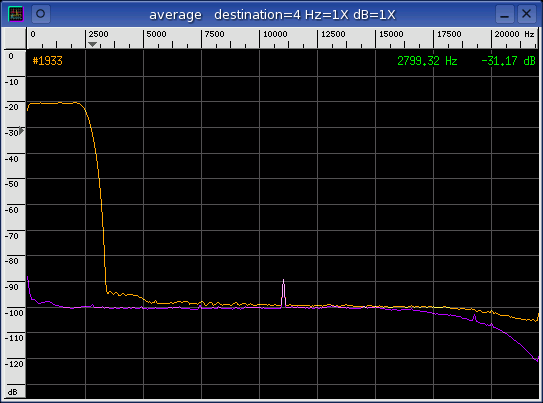
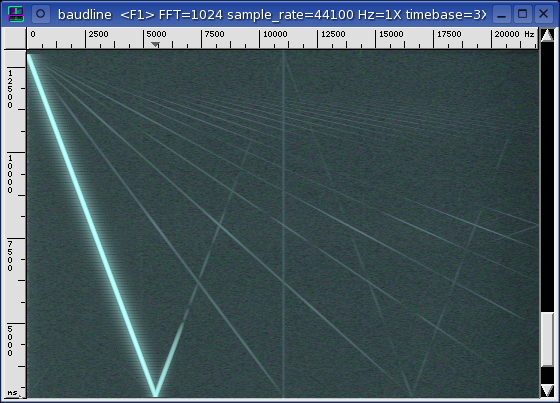
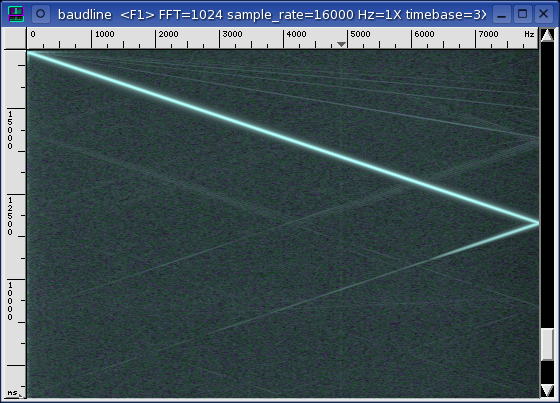
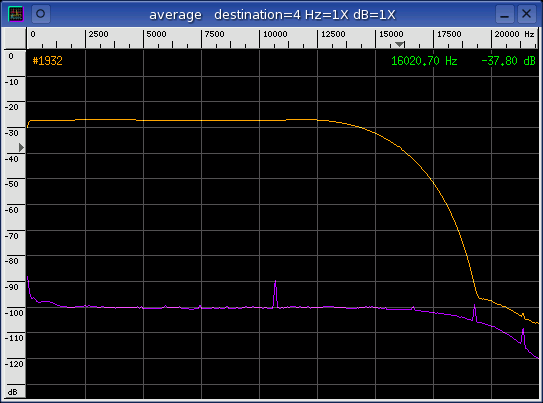
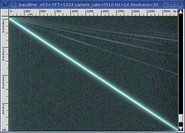
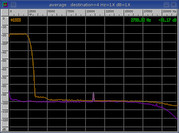
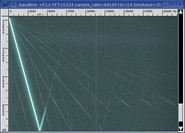
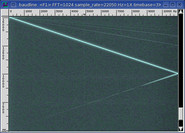
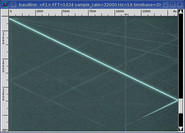
The sample rate of the input (sink) is the card's highest clean rate.
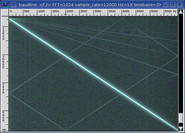
This combination tests the performance of the DAC. The linear sine sweep
signal in the middle spectrogram display characterizes the DAC filter
response. The position of the pass-band and the stop-band filter
transition is defined by the Nyquist frequency of the DAC. The noise
floor (purple) is the Average collection of a silent channel.
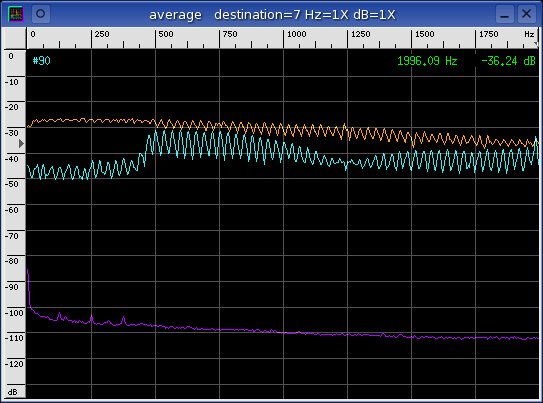
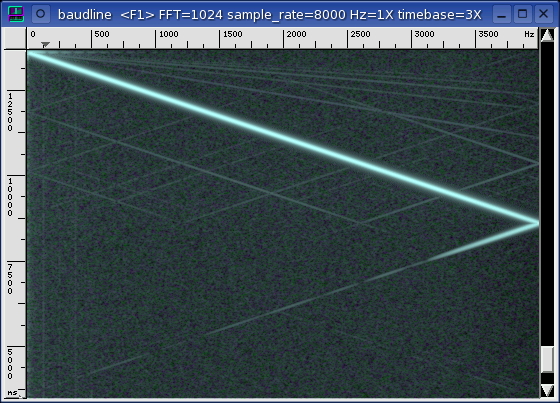
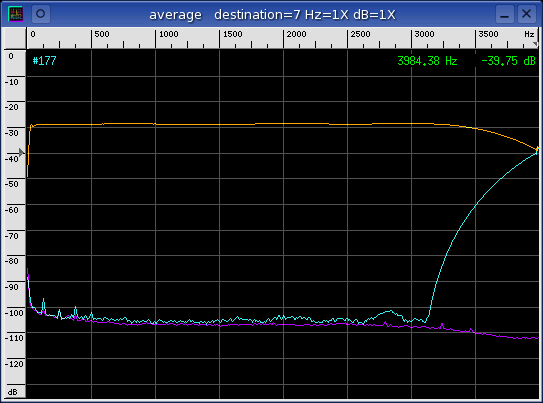
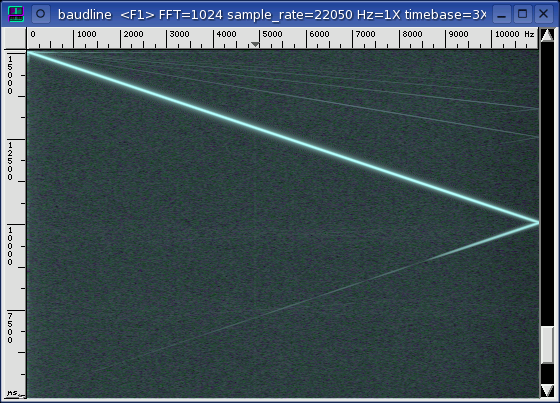
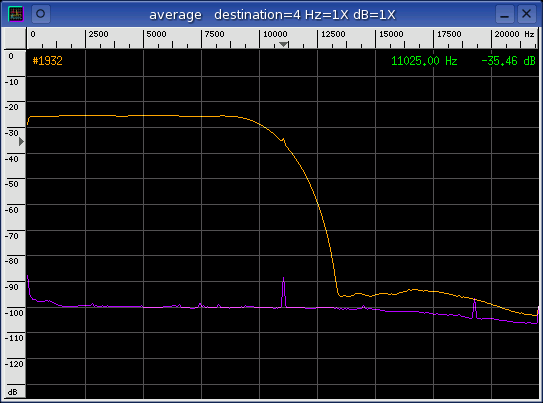
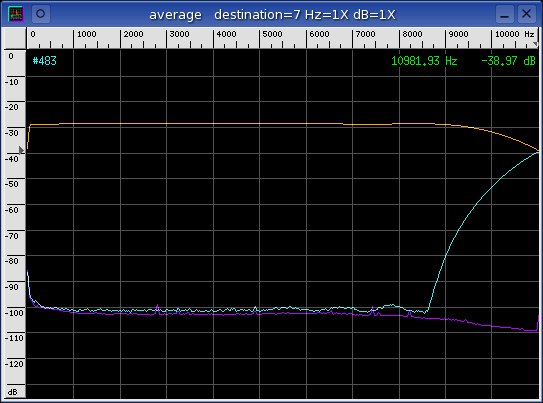
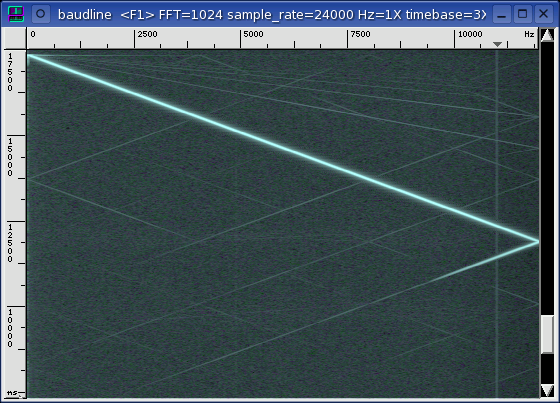
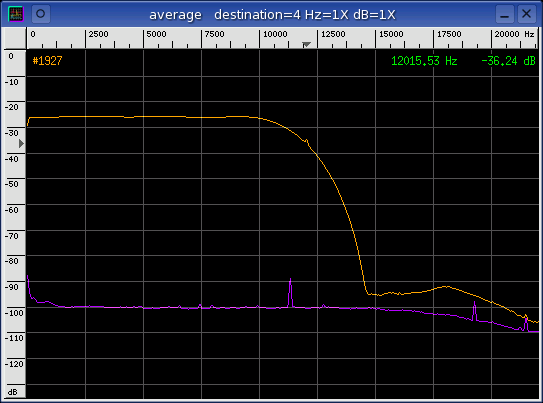
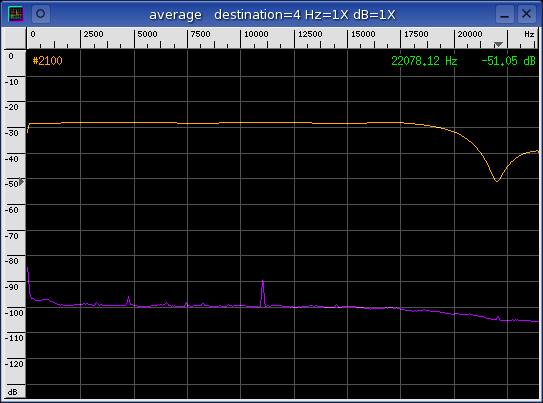
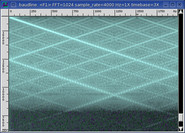
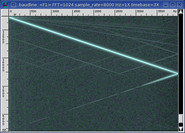
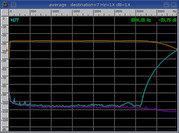
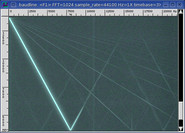
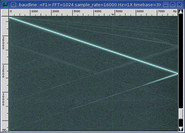
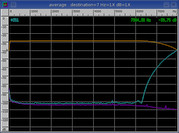
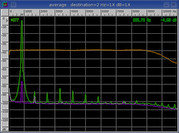
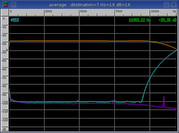
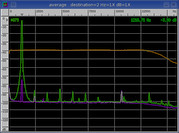
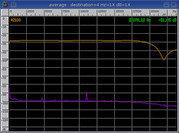
sink
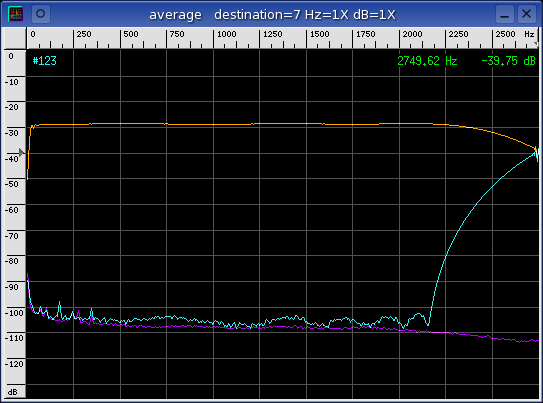
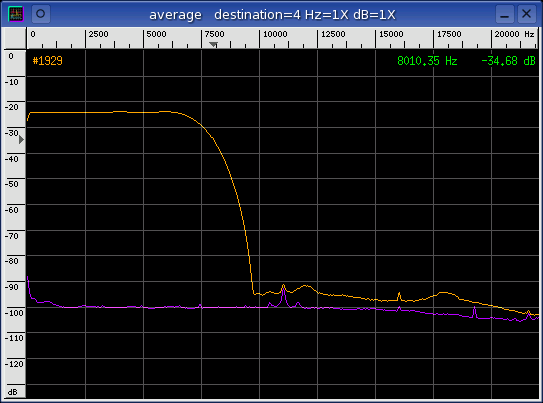
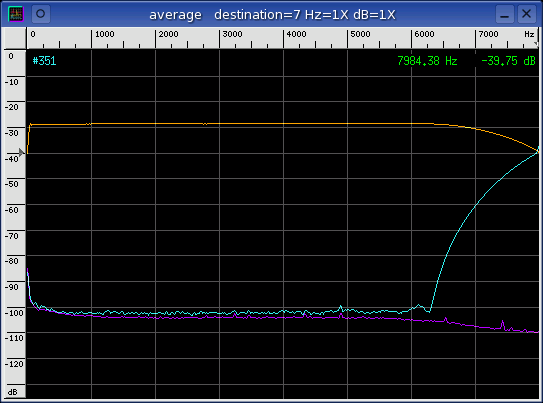
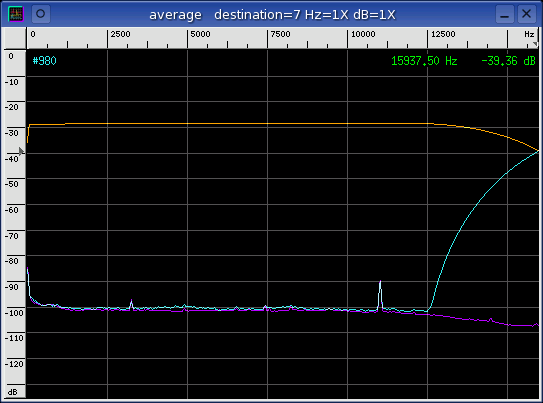
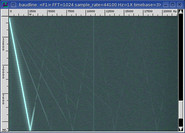
The sample rate of the output (source) is the card's highest clean rate.
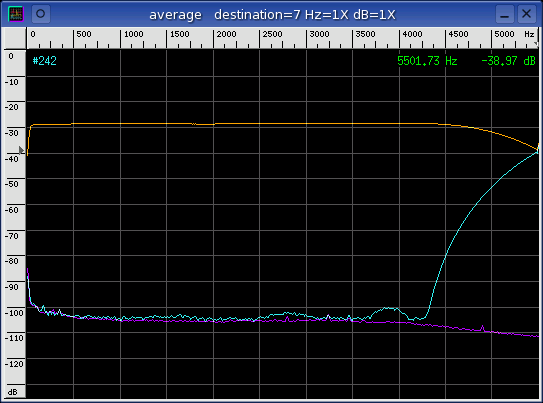
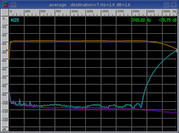
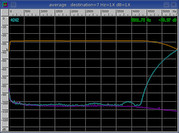
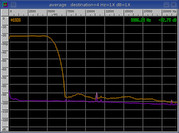
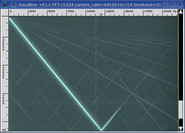
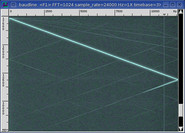
This combination tests the performance of the ADC. The linear sine sweep
signal in the rightmost spectrogram display and the orange curve in the Average
window below it characterize the ADC filter response. The position of
both the pass-band and the stop-band filter transition is defined by time in
the spectrogram and by folded frequency in the Average window. The orange Average curve represents the pass-band while the cyan curve is a folded
representation of the stop-band ADC filter response. The noise floor
(purple) is the Average collection of a silent channel.
The naming convention for the columns below is (DAC -> ADC) where DAC
represents the source sample rate and ADC represents the sink sample
rate.
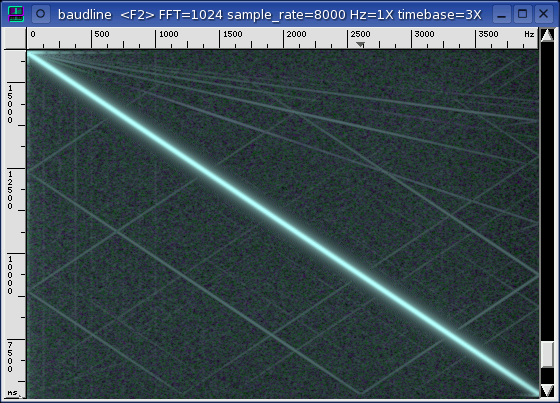
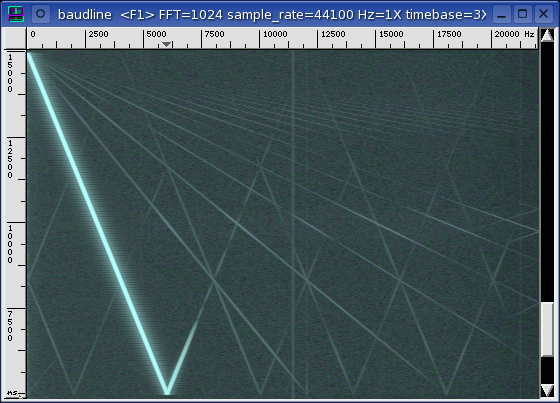
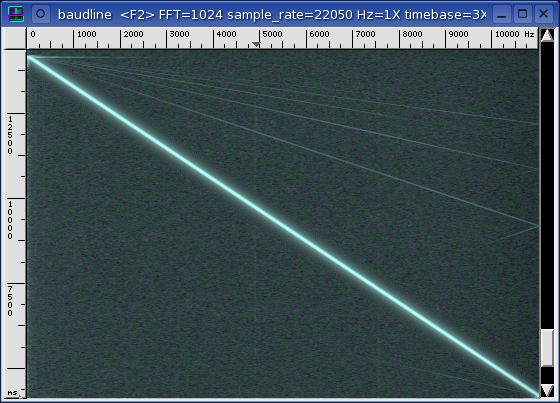
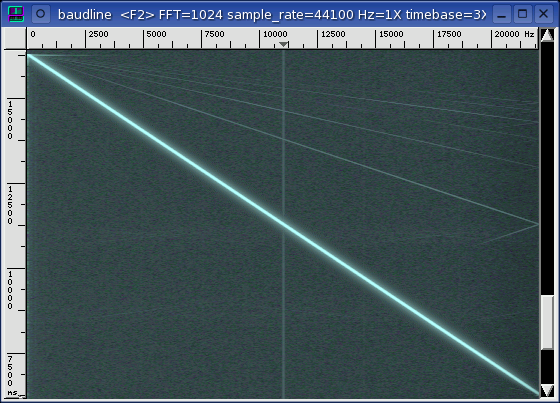
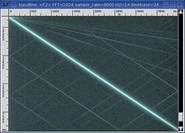
matched
|
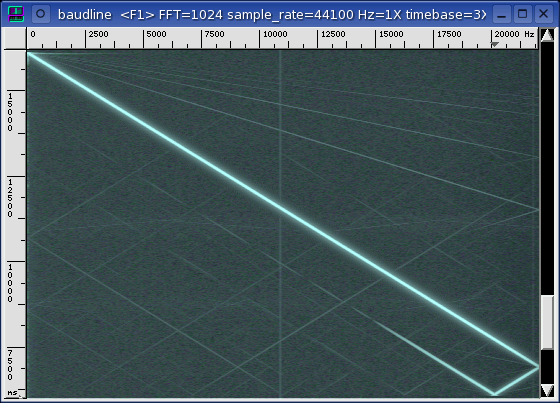
source (DAC)
|
sink (ADC)
|
|
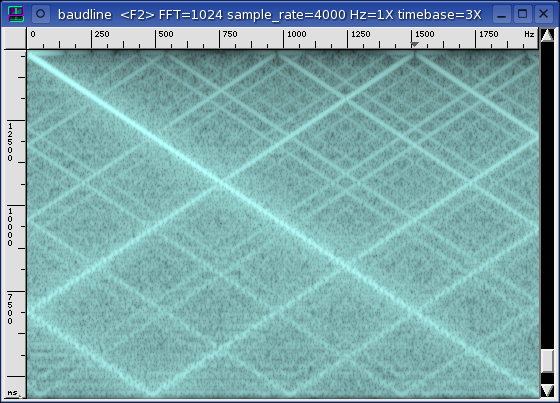
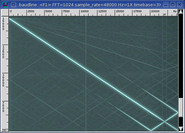
4000 -> 4000
|
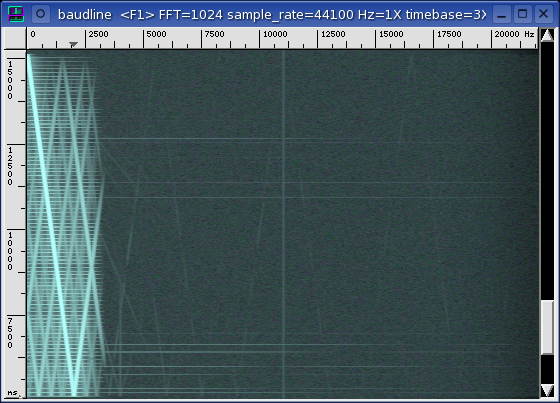
4000 -> 44100
|
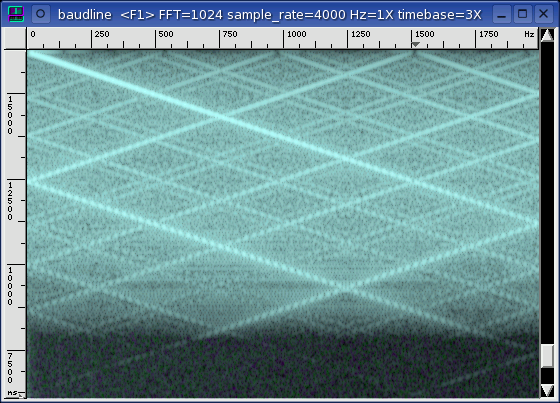
44100 -> 4000
|
|
|
|
|
|
|
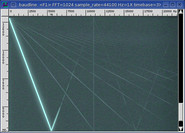
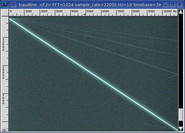
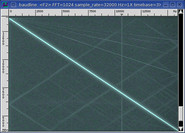
The wideband pulses in the 4000 and source spectrogram sweep has a 0.108 second
period (432 samples).
|
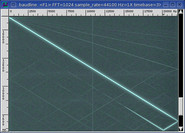
5510 -> 5510
|
5510 -> 44100
|
44100 -> 5510
|
|
|
|
|
|
|
|
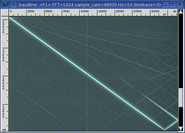
8000 -> 8000
|
8000 -> 44100
|
44100 -> 8000
|
|
|
|
|
|
|
|
11025 -> 11025
|
11025 -> 44100
|
44100 -> 11025
|
|
|
|
|

|
|
|
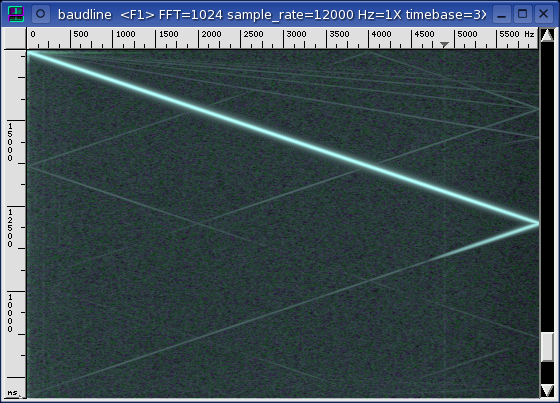
12000 -> 12000
|
12000 -> 44100
|
44100 -> 12000
|
|
|
|
|
|
|
|
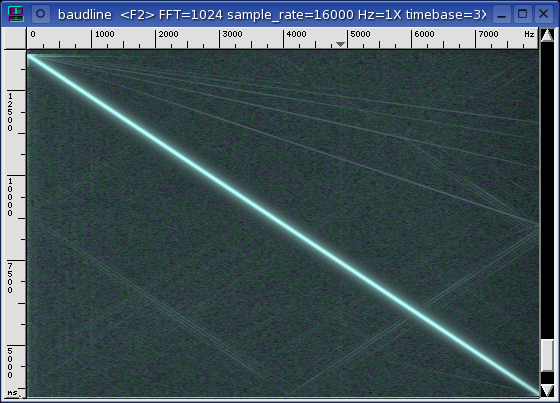
16000 -> 16000
|
16000 -> 44100
|
44100 -> 16000
|
|
|
|
|
|
|
|
22050 -> 22050
|
22050 -> 44100
|
44100 -> 22050
|
|
|
|
|
|
|
|
24000 -> 24000
|
24000 -> 44100
|
44100 -> 24000
|
|
|
|
|
|
|
|
32000 -> 32000
|
32000 -> 44100
|
44100 -> 32000
|
|
|
|
|
|
|
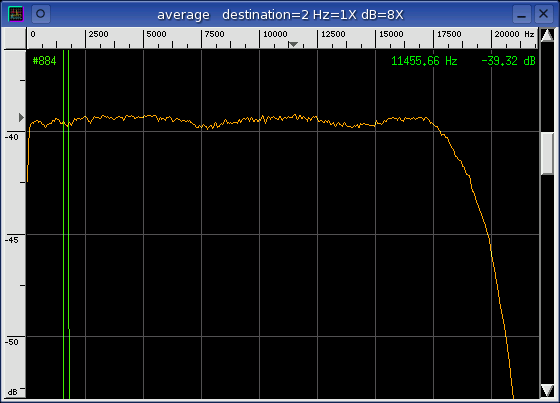
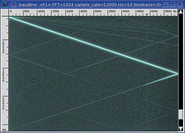
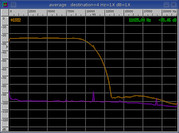
The 44100 rate has a very clean spectrogram sweep and less than 1 dB
peak-to-peak filter ripple.
|
48000 -> 48000
|
48000 -> 44100
|
44100 -> 48000
|
|
|
|
|
|
|
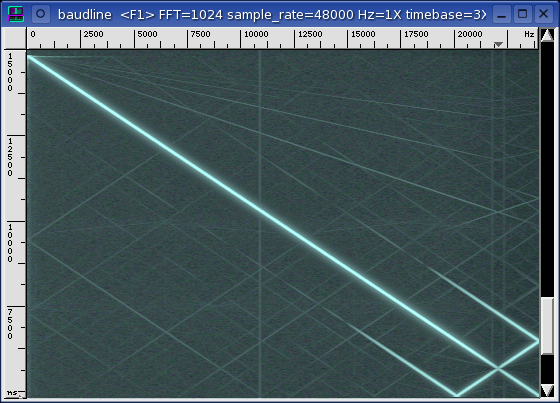
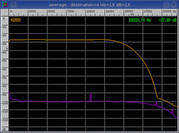
The 48000 filter has a problem. The valley of the attenuation is at 22050
Hz. It looks like a 44100 filter with some strange mirror folding.
distortion
The following table of measurements were made using the technique described in
the sine distortion application
note. It is a full duplex test that uses a loopback of the tone generator
to measure the various distortion parameters. The stereo crosstalk
column is a measure of channel leakage that uses a sine wave channel and a
silent channel as the signal sources.
| rate |
SNR |
THD |
SINAD |
ENOB |
SFDR |
crosstalk |
|
| 4000 |
+24.73 dB |
-23.40 dB |
+21.00 dB |
+3.196 bits |
+26.14 dB |
-76.34 dB |
| 5510 |
+80.48 dB |
-75.23 dB |
+74.09 dB |
+12.014 bits |
+78.96 dB |
-76.16 dB |
| 8000 |
+78.22 dB |
-76.03 dB |
+73.97 dB |
+11.994 bits |
+80.85 dB |
-75.55 dB |
| 11025 |
+78.74 dB |
-75.77 dB |
+74.00 dB |
+11.998 bits |
+80.58 dB |
-74.81 dB |
| 12000 |
+77.17 dB |
-75.79 dB |
+73.41 dB |
+11.901 bits |
+80.67 dB |
-74.46 dB |
| 16000 |
+76.93 dB |
-75.40 dB |
+73.09 dB |
+11.847 bits |
+80.75 dB |
-73.51 dB |
| 22050 |
+76.48 dB |
-74.52 dB |
+72.38 dB |
+11.729 bits |
+80.10 dB |
-71.86 dB |
| 24000 |
+74.25 dB |
-75.06 dB |
+71.63 dB |
+11.605 bits |
+80.21 dB |
-71.71 dB |
| 32000 |
+73.94 dB |
-83.72 dB |
+70.82 dB |
+11.471 bits |
+79.57 dB |
-70.04 dB |
| 44100 |
+73.66 dB |
-73.92 dB |
+70.78 dB |
+11.464 bits |
+80.07 dB |
-68.32 dB |
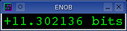
| 48000 |
+72.47 dB |
-73.19 dB |
+69.80 dB |
+11.302 bits |
+79.84 dB |
-67.35 dB |
The 44100 rate is the maximum sample rate that has the cleanest spectrogram
sweep. So the source and sink columns use 44100 instead of the standard
48000. The 48000 sample rate has a minor flaw with it's filter but this
doesn't have much effect on the distortion measurements.
The 4000 sample rate has some serious spectral problems. The CS4236B does
not natively support the 4000 rate so this spectral damage is likely caused
by the ALSA sample rate converters gone wrong.
The distortion measurements gradually improve as the sample rate
decreases. This is decimation gain, it is expected, and it is a sign of a
well designed ADC / DAC codec. The CS4236B has very sharp and very clean
filters. The average spectrum plots of the sink column have filter
curves that look almost identical. This consistency is another sign of a
well designed codec.
|
|
|
|
Quantization |
A white Gaussian noise signal source was generated and captured in full
duplex loopback fashion at each of the standard sample rates. The
Histogram plots below
show a unique sample distribution that is dependent on sample rate.
4000, 5510, 11025, 22050, 44100
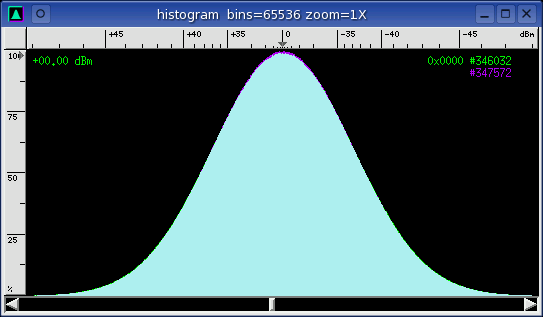
spur cadence = { none }
8000

spur cadence = { 2+, 1-, 1+, 1-, 1+, 1-, ... }
12000

spur cadence = { 1-, 2+, 1-, 3+, ... }
16000
spur cadence = { 1-, 3+, 1-, 4+, ... }
24000

spur cadence = { 1-, 5+, 1-, 5+, 1-, 6+, ... }
32000
spur cadence = { 1+, 2-, 1+, 1-, 1+, 2-, 1+, 1-, 1+, 2- ... }
48000

spur cadence = { 1-, 11+, 1-, 12+, ... }
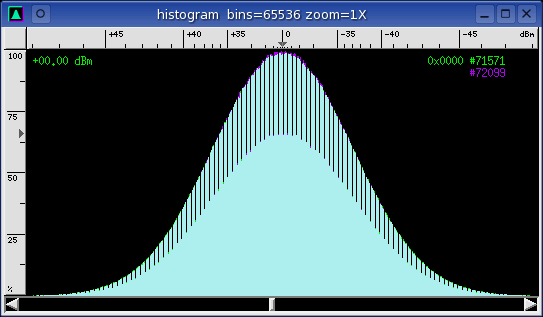
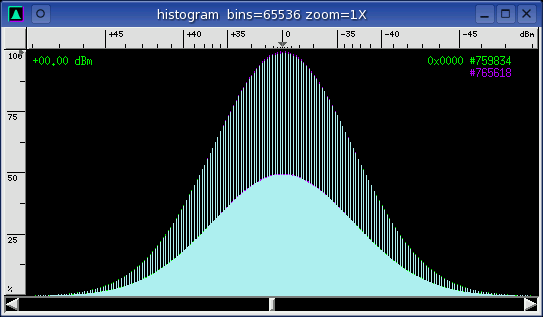
The cadence grammar occasionally skips a spur sub-phrase so it is difficult to
accurately define the exact grammar. Some very odd sample quantization
rounding and truncating must be at work. Quantization errors typically
cause spectral noise and harmonics but in this cause it has no effect on
ENOB and the other distortion measurements.
The 4000, 5510, 11025, 22050, 44100 sample rates have clean Gaussian shaped
bell curves. All of the other rates have a spur cadence grammar.
An interesting observation is that the granularity of the spur cadence gets
finer and the solidness of the Gaussian shape gets fuller as the sample rate
decreases. So the requantization with the 48000 sample rate looks like it
is the source that is causing the histogram bin holes and this damage is
propagated down to all of the divisible rates.
|
|
|
|
Channel Delay |
A sine wave signal was generated and captured in full duplex loopback
mode. The time domain response was observed with the
Waveform window where
the green curve represents the left channel and the purple curve represents
the right channel.
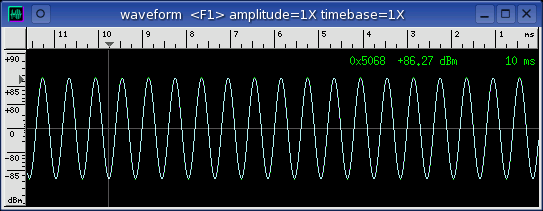
The CS4236B chipset has a zero sample inter channel delay.
|
|
|
|
Analysis |
The 48000 sample rate has a number of flaws such as absolute sample rate,
folded frequency domain filter shape, and quantization holes that suggest it
is derived from the 44100 rate. The 44100 rate is very clean in all
respects and it is the CS4236B's native sample rate.
The CS4236B has very clean filters all sample rates expect 4000 and
48000. The sample rate, spectrogram sweeps, and histogram quantization
shapes are best at 11025, 22050, and 44100 but all of the other rates have
good performance.
The initial sample rate conversion from the 44100 base to 48000 and 32000
create some very interesting artifacts in the sample rate, frequency, and
quantization domains. The propagation of these flaws can then be traced
down through the following decimation by 2 series { 48000 24000 12000 } and
{ 32000 16000 8000 4000 }.
|
|
|
|
Conclusion |
For the highest performance with the CS4236B chipset use the 11025, 22050, or
44100 sample rates.
The 5510, 8000, 12000, 16000, 24000, 32000 sample rates have slight spectrogram
sweep noise and mild histogram quantization irregularity. Strangely these
minor flaws have have no ill effect on the distortion measurements. The
CS4236B has very high quality filters so the performance is quite good.
These rates do have large absolute sample rate errors so if exact frequency
accuracy is an issue then avoid these rates.
Do not use the 4000 rate since it is broken. Avoid using the 48000
sample rate because it has poor filtering.
|
|
|
|

Copyright © 2005 SigBlips.com
- group
- blog
- site map
|