|
|
|
Information |
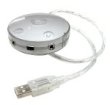  Griffin iMic v0.06
| vendor |
Griffin Technology
|
| product |
iMic v0.06
|
| interface |
USB 1.1 |
| duplex |
full |
| channels |
2 |
| resolution |
16 bits |
| max rate |
48 Ksample/sec |
| codec |
Philips UDA1325H
|
| operating system |
Ubuntu 5.04 Linux x86 2.6.10-5 |
driver |
usb_audio ALSA 1.0.6 |
buffer size |
input 64 KB, output 64 KB |
| test date |
Sep 19 2005 |
| notes |
Frequent reseting and replugging of the iMic v0.06 device is necessary.
Occasionally the test machine hangs and the system has to be rebooted.
This iMic version has a thin USB cable.
Vendor=077d ProdID=07af Rev=0.06
|
This card is part of the Full Duplex DAQ comparison
survey.
|
|
|
|
Sample Rate |
The sample rate on DAQ cards is not a fixed absolute constant. Like time,
it fluctuates, and it is difficult to measure accurately. Sometimes there
are relationships between the input and output sample rates that can reveal
interesting details about the inner working machinery.
The following table of measurements use a technique described in the
sample rate stability application
note. The rate column is the sample rate value that the collection
hardware is programmed to. The in/out rate and in/out error
columns are absolute measurements of the ADC / DAC clock. The
loop error column uses a tone generator loopback method for a high
accuracy measurement of the relative difference between the ADC and the DAC
clocks. The three error
PPM columns are theoretically
related by the formula: "in_error - out_error = loop_error"
Note that the test machine was not
NTP disciplined since it was
running from a live Linux-CD. Previously the /etc/ntp/drift error for
this machine was -7.858 PPM which can be used as a rough correction factor.
| rate |
in rate |
out rate |
in error |
out error |
loop error |
|
|
| 4000 |
4000.576 |
4000.619 |
+144.000 PPM |
+154.750 PPM |
±91.5679 PPM |
* |
# |
| 5510 |
5510.664 |
5510.530 |
+120.508 PPM |
+96.1887 PPM |
±34.7539 PPM |
* |
# |
| 8000 |
8000.66 |
8001.22 |
+82.5000 PPM |
+152.500 PPM |
±7.3945 PPM |
* |
| 11025 |
11026.12 |
11025.70 |
+101.587 PPM |
+63.4921 PPM |
±220.925 PPM |
* |
# |
| 12000 |
12001.25 |
12001.01 |
+104.167 PPM |
+84.1667 PPM |
±89.9847 PPM |
* |
# |
| 16000 |
16002.49 |
16002.31 |
+155.625 PPM |
+144.375 PPM |
±7.6724 PPM |
* |
| 22050 |
22053.19 |
22052.77 |
+144.671 PPM |
+125.624 PPM |
±11.0448 PPM |
* |
# |
| 24000 |
24003.52 |
24003.29 |
+146.667 PPM |
+137.083 PPM |
±11.6123 PPM |
* |
| 32000 |
32005.06 |
32005.07 |
+158.125 PPM |
+158.438 PPM |
±2.3727 PPM |
| 44100 |
44107.15 |
44107.16 |
+162.132 PPM |
+162.358 PPM |
±2.2082 PPM |
| 48000 |
48007.95 |
48007.94 |
+165.625 PPM |
+165.417 PPM |
±2.4842 PPM |
The "#" symbol signifies the existence of many discontinuities in the
the absolute sample rate measurement. The accuracy of the affected
in / out rates is questionable.
The "*" symbol signifies that many spectral glitches were observed in the
the loop error measurement. This has only a minor effect on
accuracy since the Hz measurement was jumping around, hence the "±"
sign. The loop error data should be considered highly erroneous and it is
a sign that something deeper is at work. This will be further
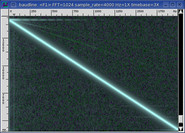
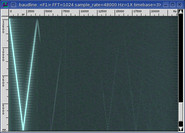
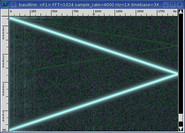
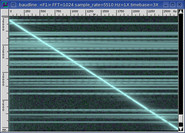
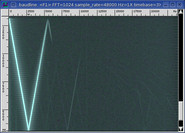
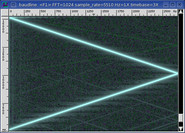
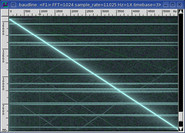
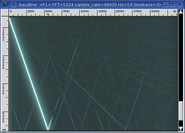
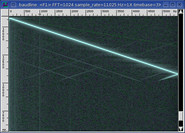
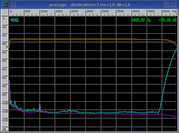
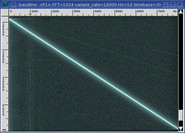
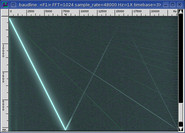
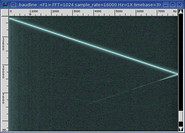
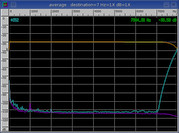
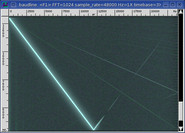
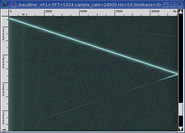
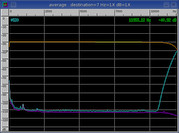
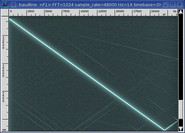
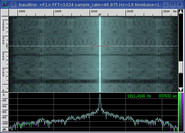
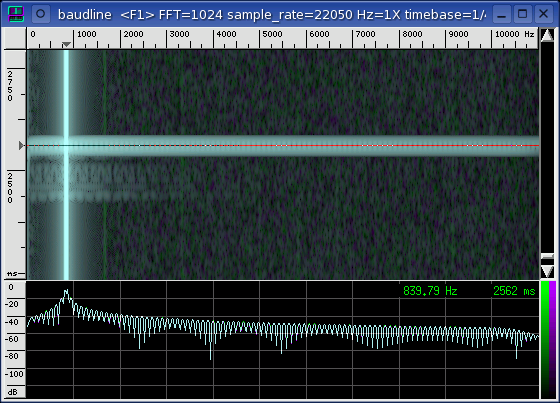
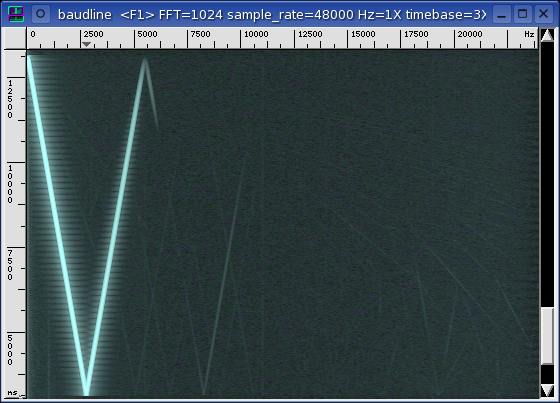
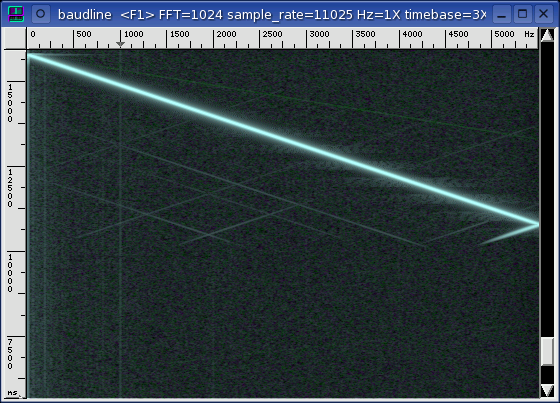
explored in the Frequency Domain section. Below is an example of
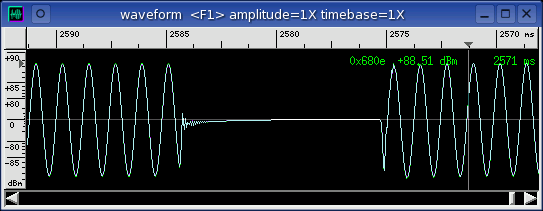
what the wideband spectral glitch looks like.
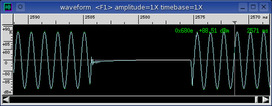
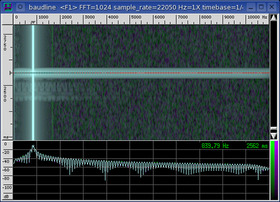
The spectrogram shows a faint ringing after the wideband burst for about 0.1
seconds. The particular zero gap in the waveform plot is about 0.01
seconds in duration. The zero gap begins with a decay to DC so the
zero fill is occurring with the DAC stage.
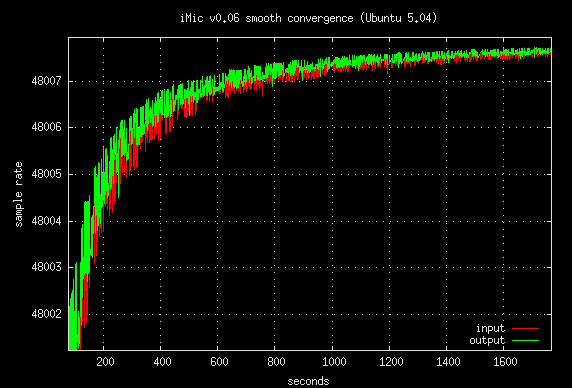
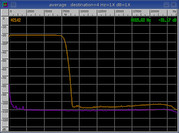
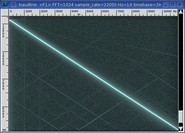
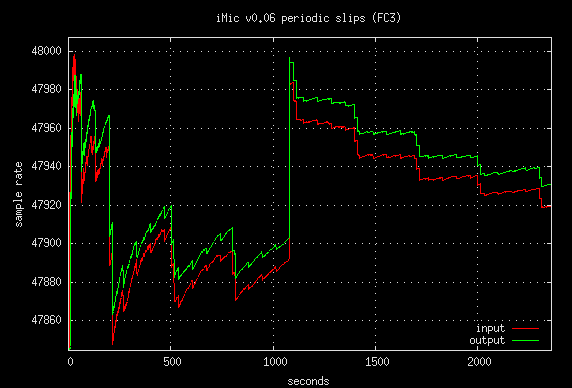
For further investigation the -debugrate command line option was used to
create the sample rate estimate plot shown below.
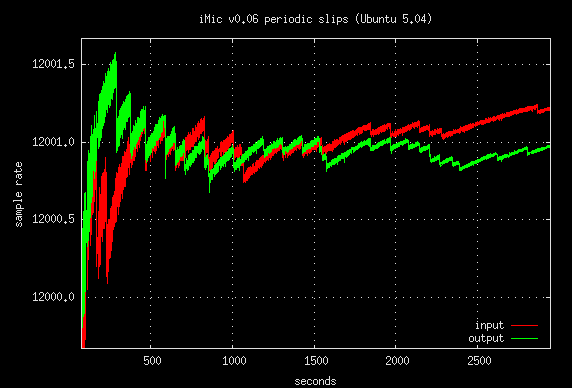
A popular periodicity in the above plot is 120 seconds. 60 seconds also
pops up a couple times but the periodicity looks to be mostly random. The
discontinuities in the above plot look a lot like fragment drops but no
xruns were reported.
Also, the periodic slips have a weak correlation with the timing of the
spectral glitches.
This is not a normal sample rate convergence curve and it could be a problem
with the design of the iMic or with the Linux USB audio drivers. The
32000, 44100, and 48000 sample rates exhibit no instabilities so this is a
sample rate dependent problem.
Initially this entire test suite was run with Fedora core3 (FC3) 2.6.11-1 ALSA
1.0.9rc2 on the same hardware. The sample rate PPM errors were one to two
orders magnitude greater with Fedora (see
image). This made testing so
difficult that FC3 was abandoned for Ubuntu 5.04. What is odd is that the
components of Fedora and Ubuntu are extremely similar and very close in version
number. Kernel 2.6.11-1 vs. 2.6.10-5 and ALSA 1.0.9rc2 vs. 1.0.6.
|
|
|
|
Frequency Domain
|
The sound card's input and output jacks are connected with a short external
cable and run in full duplex mode. This is a loopback test and baudline's
tone generator is the signal source. Distortion, noise floor, filter
response, and inter channel crosstalk are the frequency domain measurements of
interest in this section.
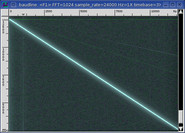
The signal test sources are a pure sine wave, a linear sine sweep, and
WGN. The sine wave is
used for the distortions and crosstalk measurements. The linear sine
sweep and WGN are used for the filter characterization measurement.
Both are an application of the
swept sine vs. WGN technique
and are equivalent measures of the frequency response.
Since spectral performance is a function of sample rate, each of the sound
card's native rates will be tested. The highest sample rate is usually
the cleanest and this is advantageous because it allows the isolated testing
of the ADC and the
DAC. The matched,
source, and sink sample rate combinations are described below.
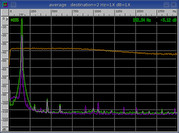
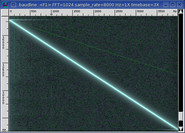
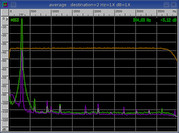
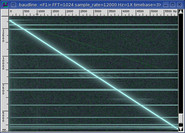
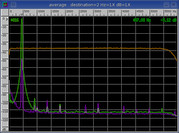
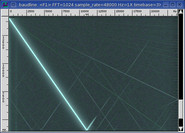
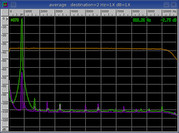
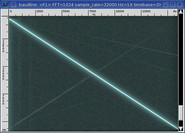
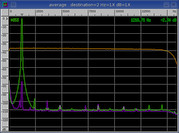
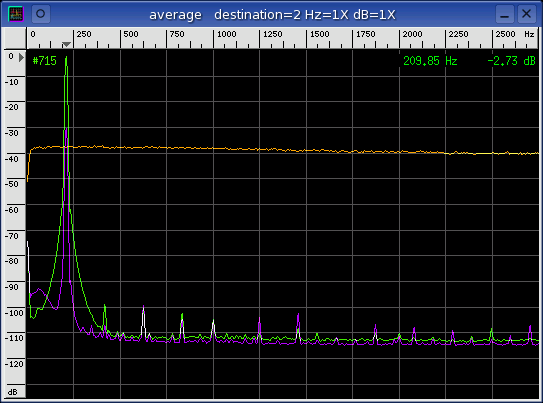
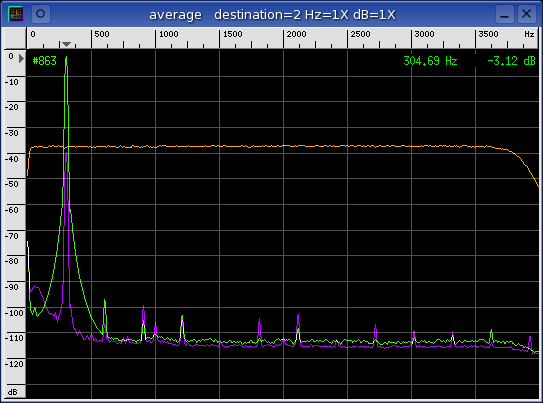
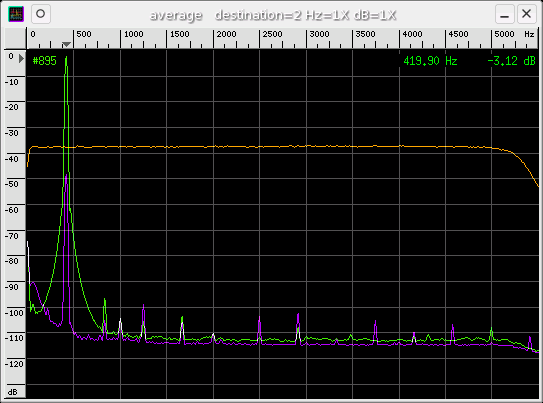
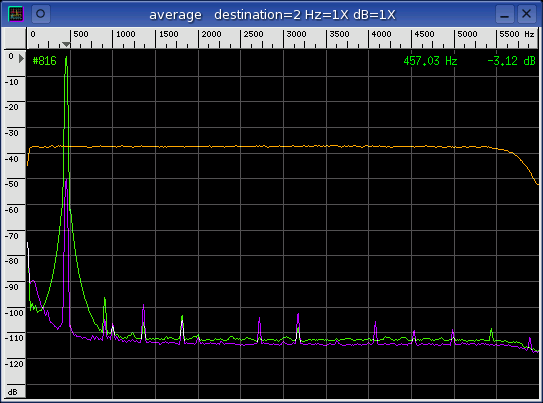
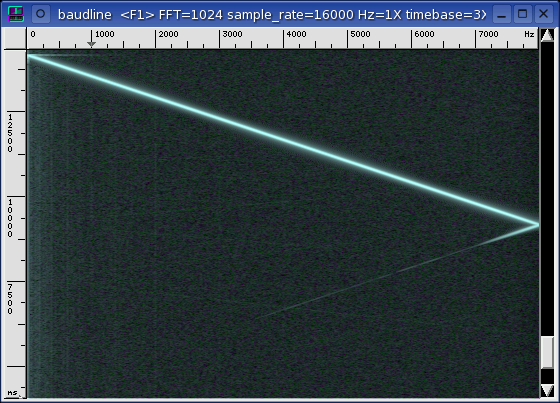
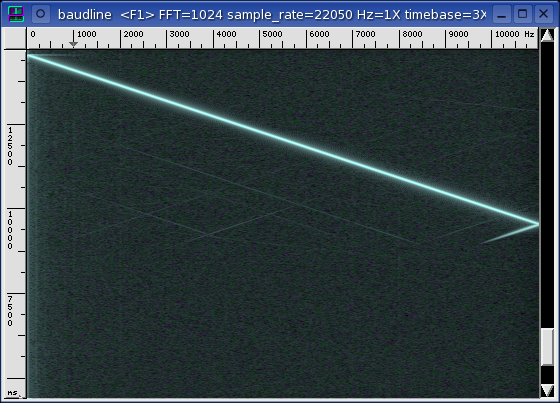
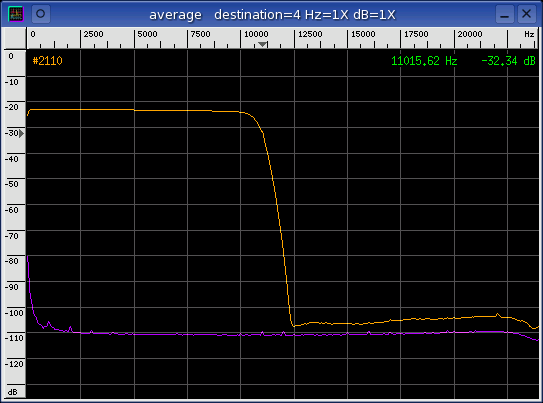
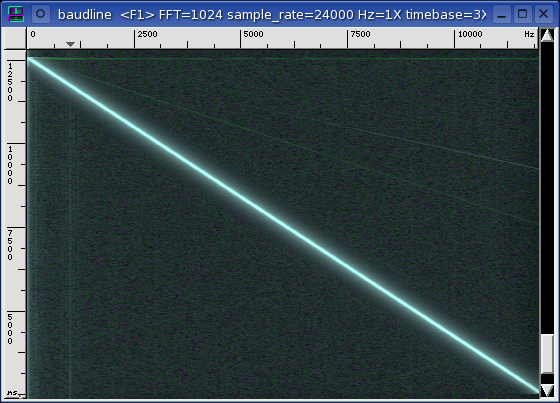
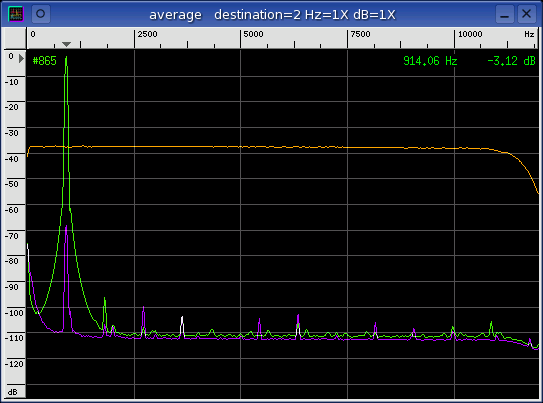
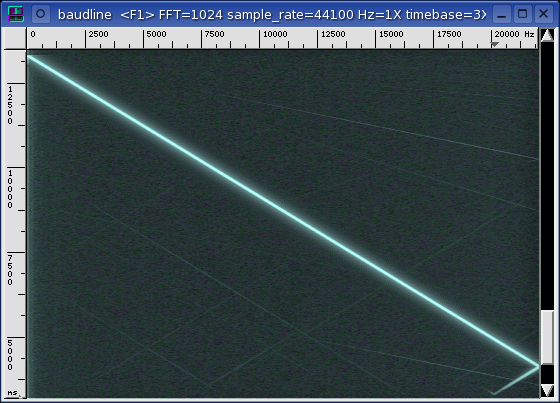
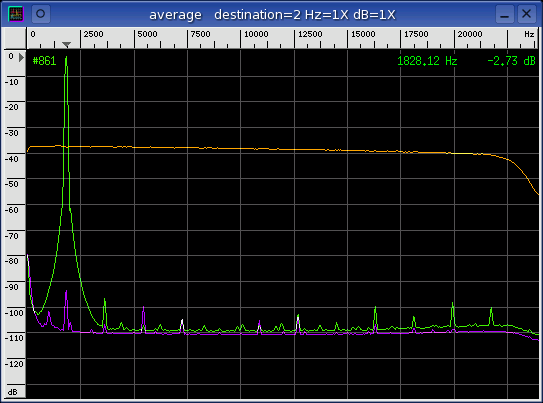
matched
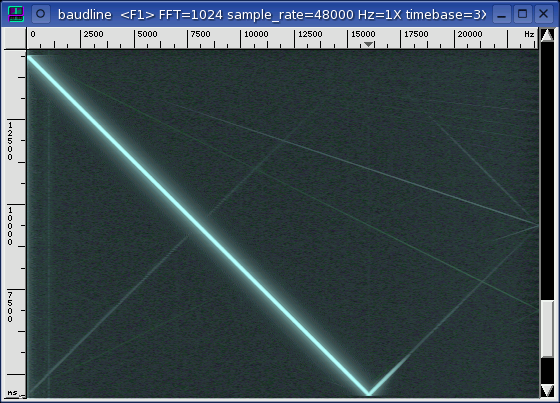
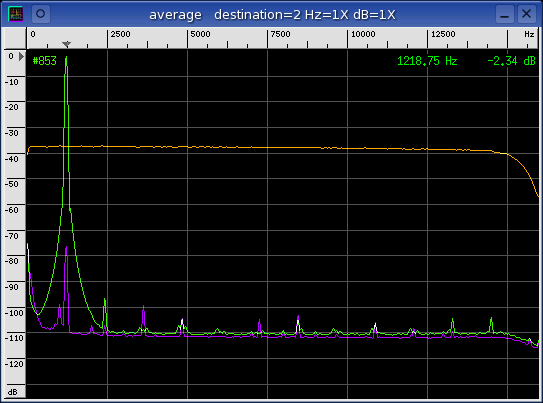
The input and output sample rates are the same. This combination tests
the performance of both the ADC and the DAC in a matched mode of
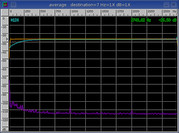
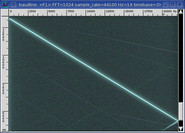
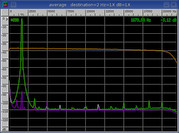
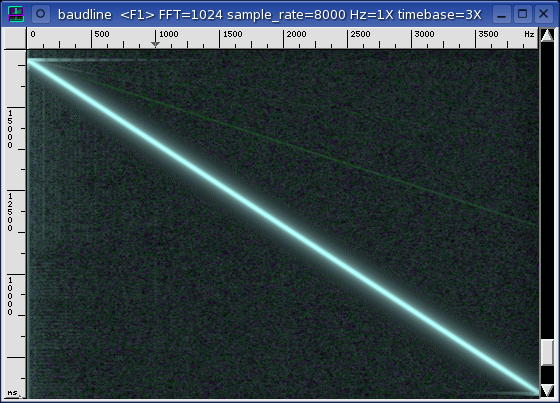
operation. The linear sine sweep signal in the left spectrogram display
and the WGN (orange) in the Average window characterize the in-band filter
response. The sine wave (green) in the Average window is used for
distortion and crosstalk measurements. The sine leakage (purple) is used
for crosstalk measurement
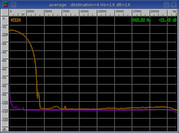
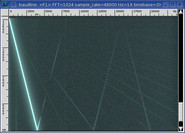
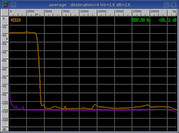
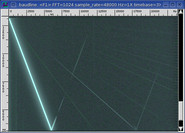
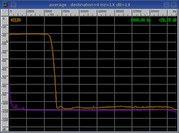
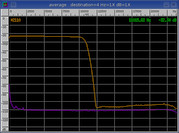
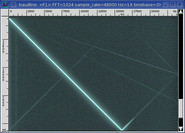
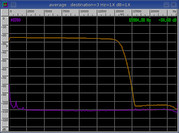
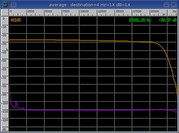
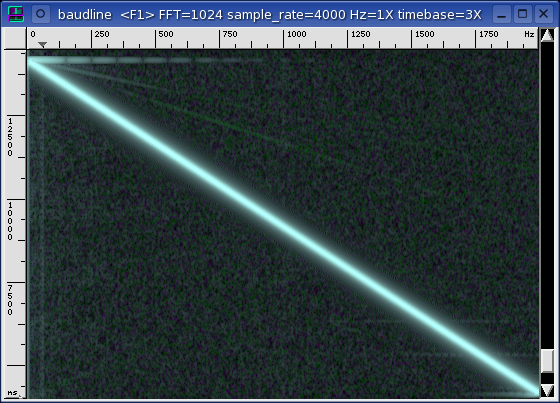
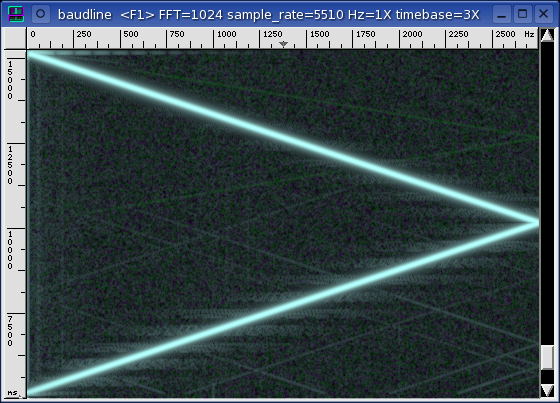
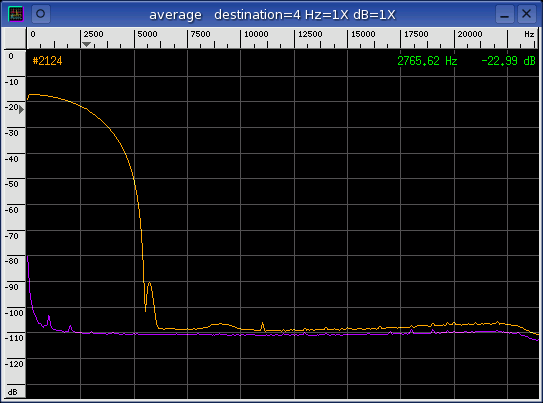
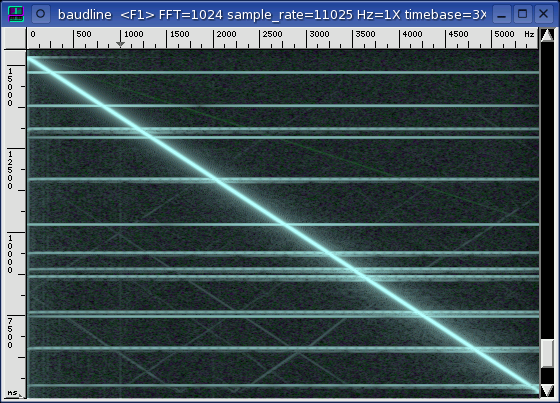
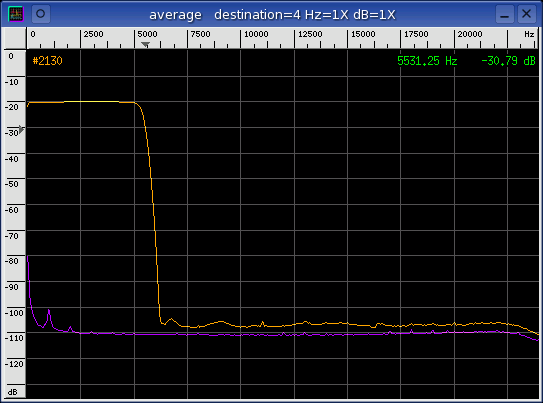
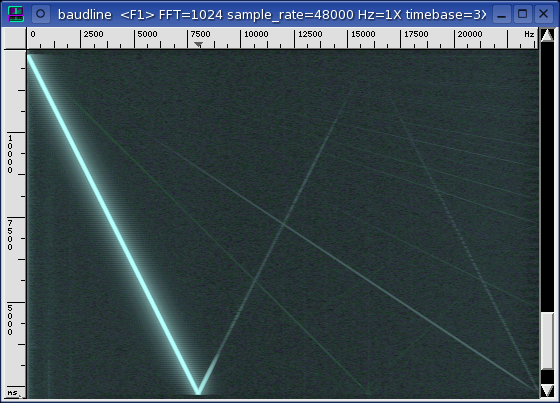
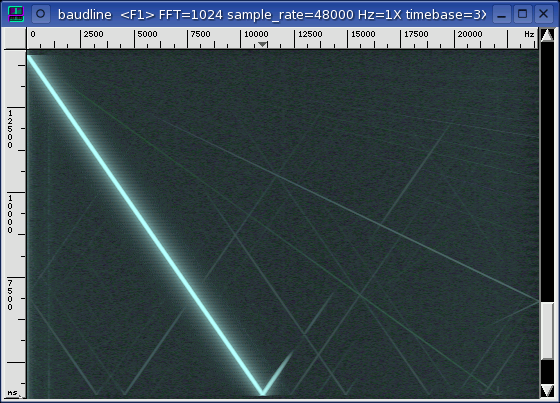
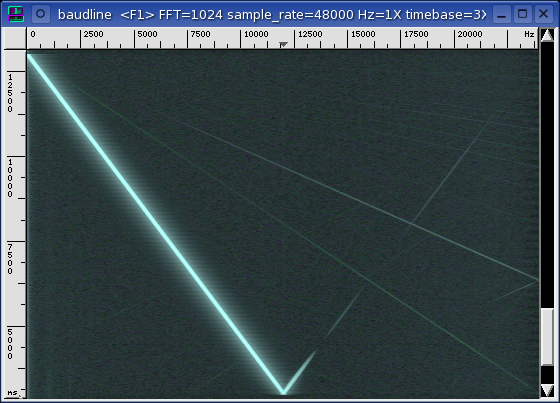
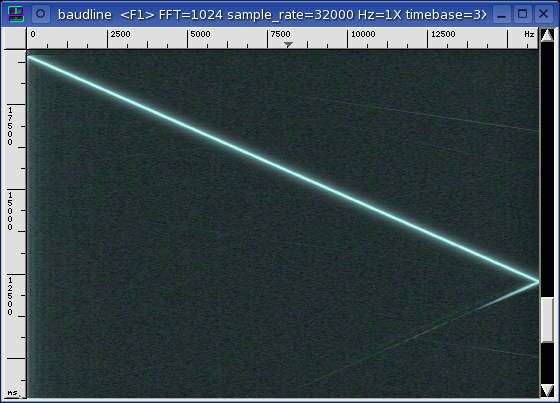
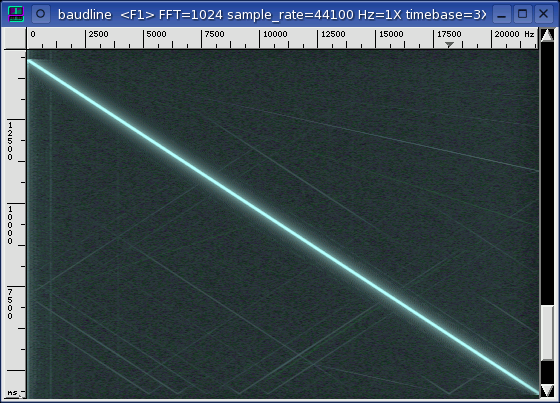
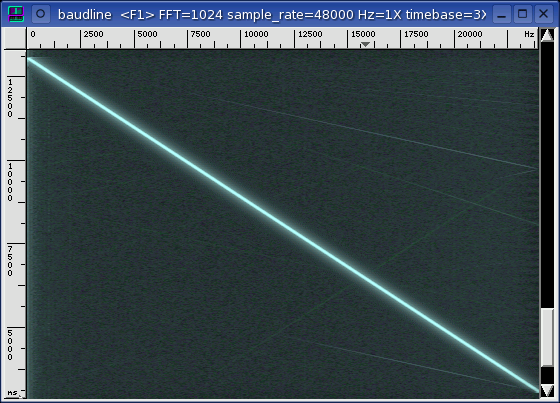
source
The sample rate of the input (sink) is the card's highest clean rate.
This combination tests the performance of the DAC. The linear sine sweep
signal in the middle spectrogram display characterizes the DAC filter
response. The position of the pass-band and the stop-band filter
transition is defined by the Nyquist frequency of the DAC. The noise
floor (purple) is the Average collection of a silent channel.
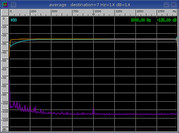
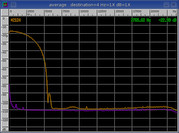
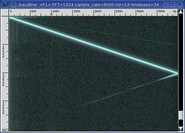
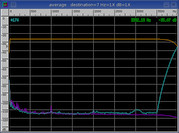
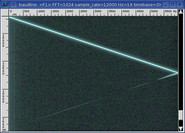
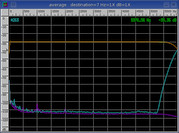
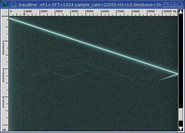
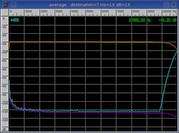
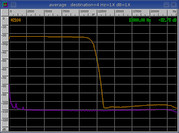
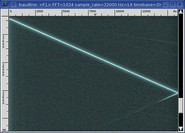
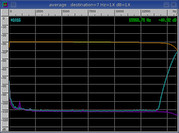
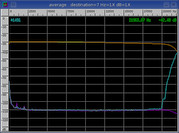
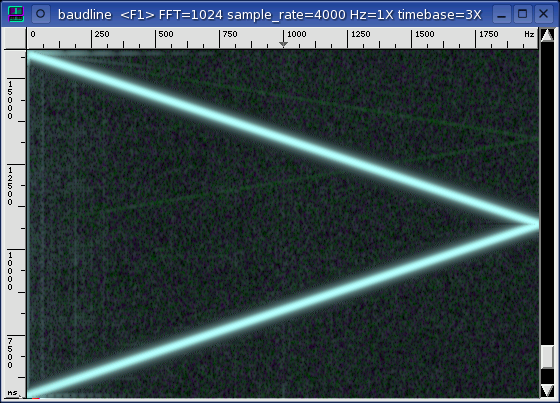
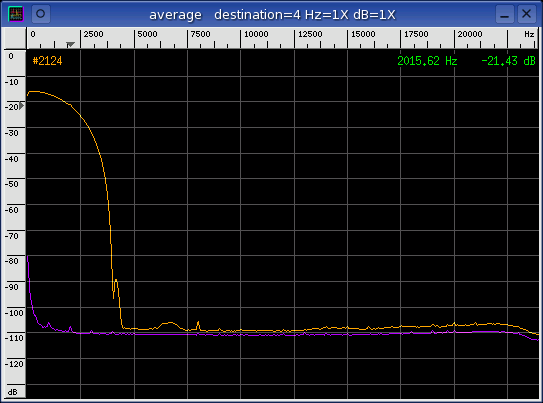
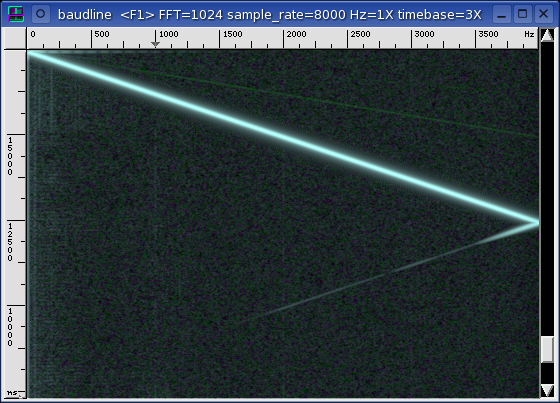
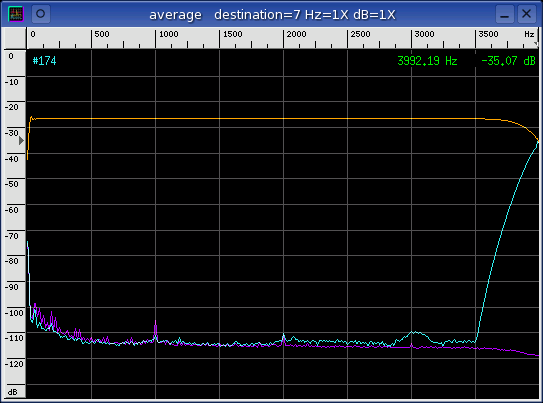
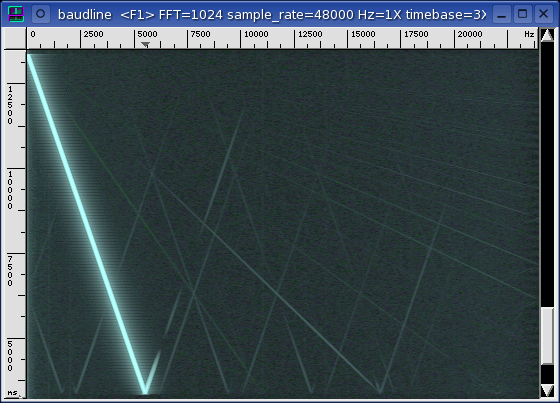
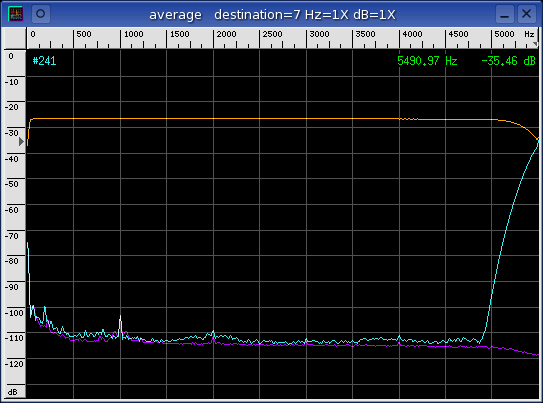
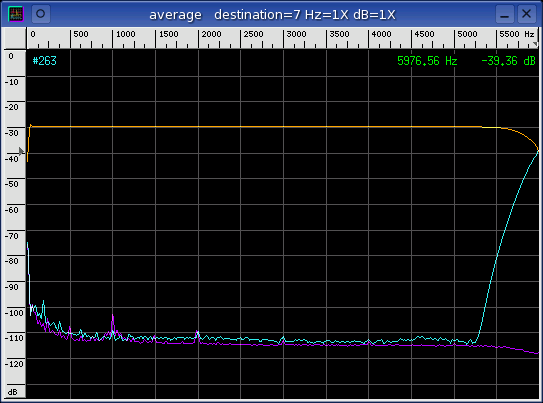
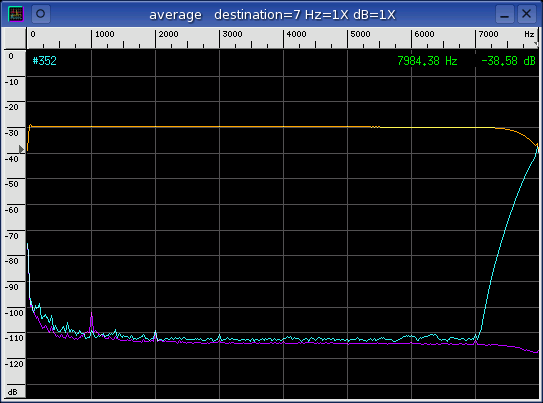
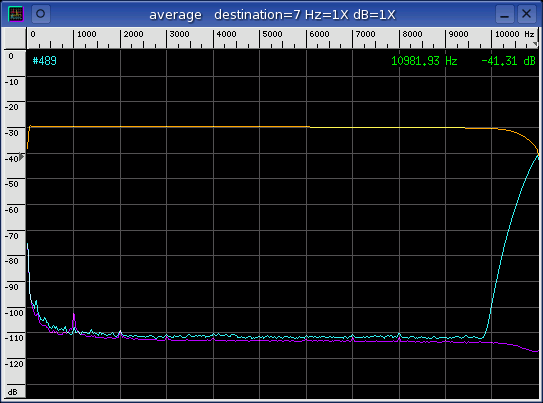
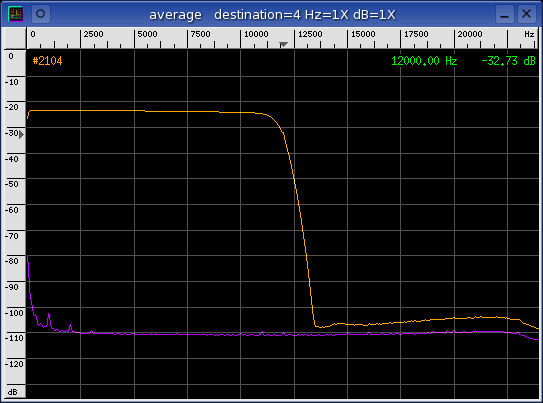
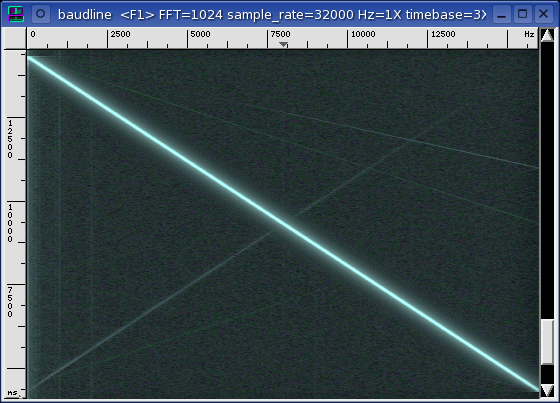
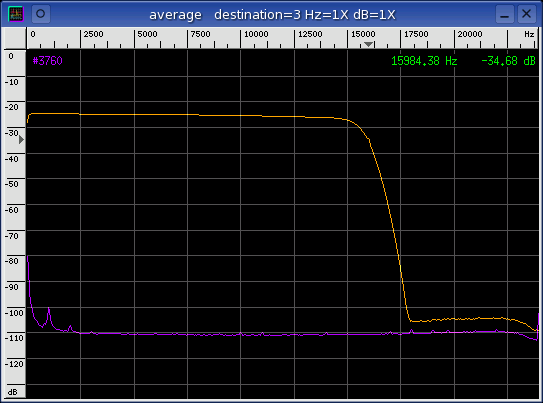
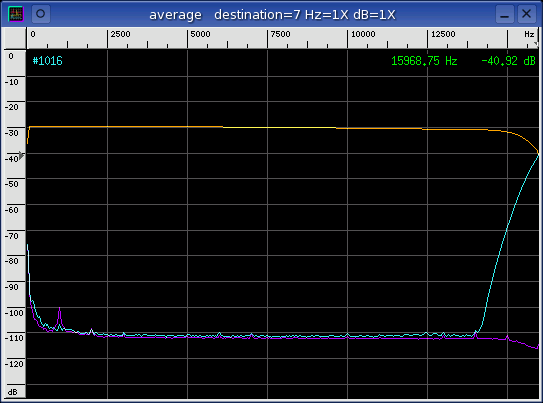
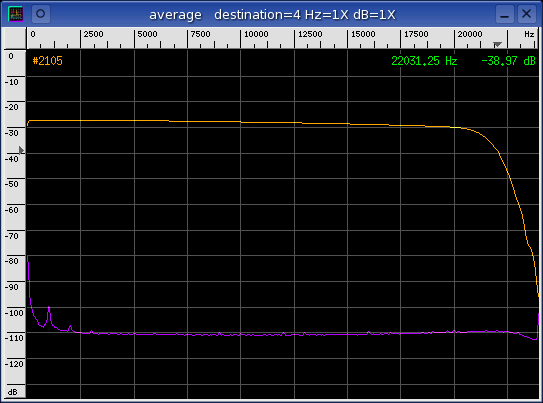
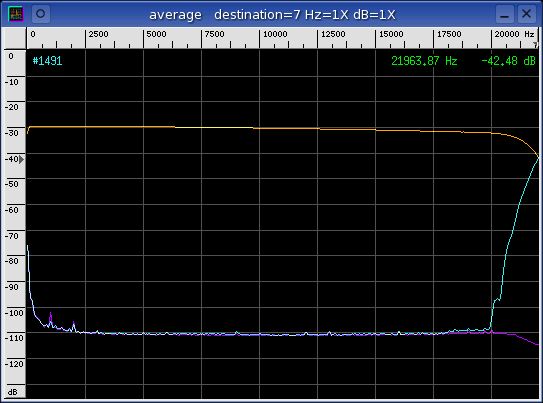
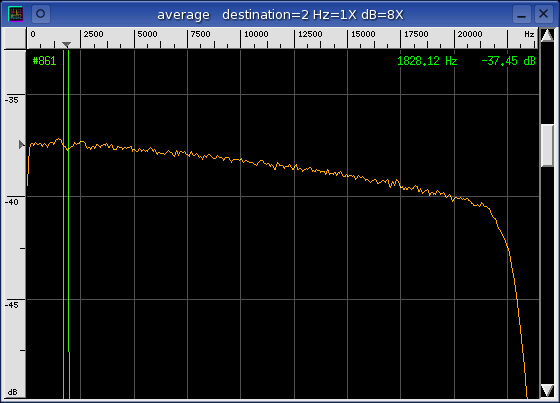
sink
The sample rate of the output (source) is the card's highest clean rate.
This combination tests the performance of the ADC. The linear sine sweep
signal in the rightmost spectrogram display and the orange curve in the Average
window below it characterize the ADC filter response. The position of
both the pass-band and the stop-band filter transition is defined by time in
the spectrogram and by folded frequency in the Average window. The orange Average curve represents the pass-band while the cyan curve is a folded
representation of the stop-band ADC filter response. The noise floor
(purple) is the Average collection of a silent channel.
The naming convention for the columns below is (DAC -> ADC) where DAC
represents the source sample rate and ADC represents the sink sample
rate.
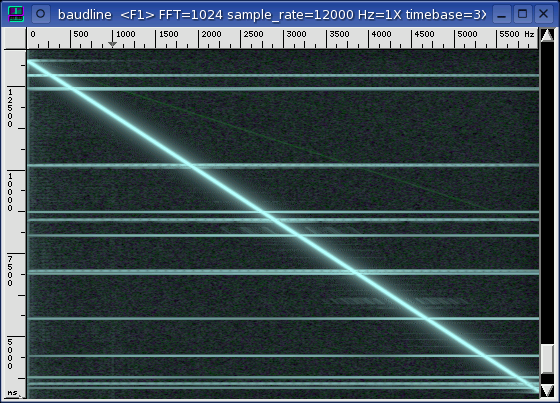
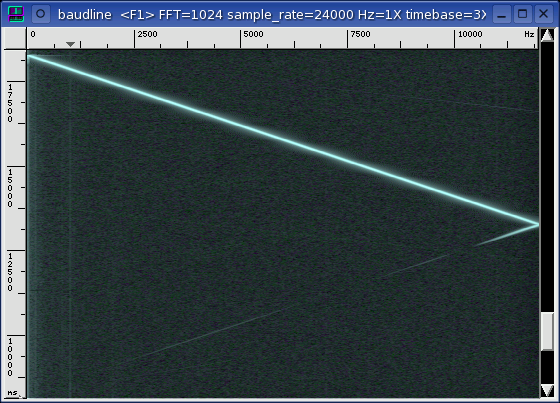
matched
|
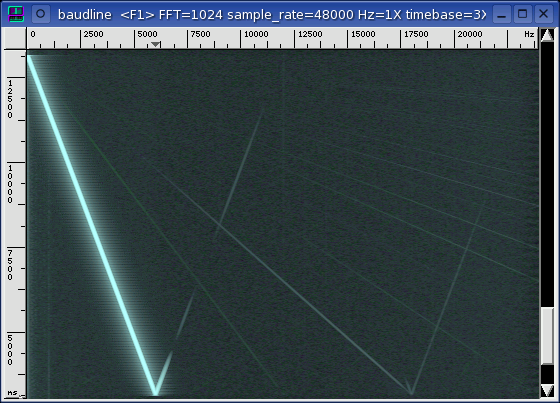
source (DAC)
|
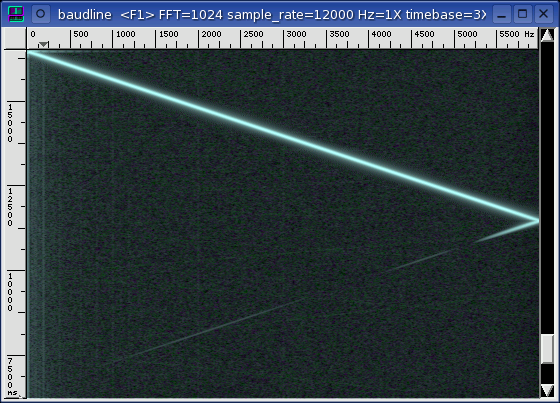
sink (ADC)
|
|
4000 -> 4000
|
4000 -> 48000
|
48000 -> 4000
|
|
|
|
|
|
|
|
5510 -> 5510
|
5510 -> 48000
|
48000 -> 5510
|
|
|
|
|
|
|
|
8000 -> 8000
|
8000 -> 48000
|
48000 -> 8000
|
|
|
|
|
|
|
|
11025 -> 11025
|
11025 -> 48000
|
48000 -> 11025
|
|
|
|
|
|
|
|
12000 -> 12000
|
12000 -> 48000
|
48000 -> 12000
|
|
|
|
|
|
|
|
16000 -> 16000
|
16000 -> 48000
|
48000 -> 16000
|
|
|
|
|
|
|
|
22050 -> 22050
|
22050 -> 48000
|
48000 -> 22050
|
|
|
|
|
|
|
|
24000 -> 24000
|
24000 -> 48000
|
48000 -> 24000
|
|
|
|
|
|
|
|
32000 -> 32000
|
32000 -> 48000
|
48000 -> 32000
|
|
|
|
|
|
|
|
44100 -> 44100
|
44100 -> 48000
|
48000 -> 44100
|

|
|
|
|
|
|
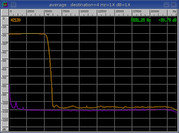
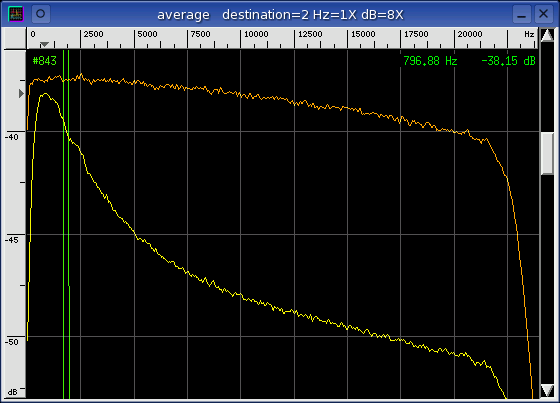
Fedora core3 and Ubuntu 5.04 had identical ADC and DAC filter shapes. The
spectral glitching in FC3 was more prominent which increased the difficultly of
making clean measurements. FC3 had an odd pink noise shaped frequency
response [yellow] that required equalization [orange] by manually adjusting
the Bass and Treble controls of an external mixer program (see
image). The default spectral
shape for Ubuntu 5.04 was a flat frequency response.
distortion
The following table of measurements were made using the technique described in
the sine distortion application
note. It is a full duplex test that uses a loopback of the tone generator
to measure the various distortion parameters. The stereo crosstalk
column is a measure of channel leakage that uses a sine wave channel and a
silent channel as the signal sources.
| rate |
SNR |
THD |
SINAD |
ENOB |
SFDR |
crosstalk |
|
| 4000 |
+86.59 dB |
-90.24 dB |
+85.03 dB |
+13.831 bits |
+94.93 dB |
-19.70 dB |
| 5510 |
+86.64 dB |
-89.76 dB |
+84.92 dB |
+13.812 bits |
+94.61 dB |
-27.90 dB |
| 8000 |
+87.59 dB |
-90.98 dB |
+85.95 dB |
+13.984 bits |
+94.48 dB |
-37.56 dB |
| 11025 |
+86.52 dB |
-90.35 dB |
+85.01 dB |
+13.828 bits |
+94.04 dB |
-45.87 dB |
| 12000 |
+85.99 dB |
-90.24 dB |
+84.60 dB |
+13.760 bits |
+93.65 dB |
-48.06 dB |
| 16000 |
+85.92 dB |
-89.56 dB |
+84.36 dB |
+13.719 bits |
+93.41 dB |
-55.44 dB |
| 22050 |
+86.69 dB |
-89.17 dB |
+84.74 dB |
+13.783 bits |
+93.26 dB |
-63.72 dB |
| 24000 |
+86.02 dB |
-89.24 dB |
+84.33 dB |
+13.715 bits |
+93.60 dB |
-65.93 dB |
| 32000 |
+85.58 dB |
-88.70 dB |
+83.85 dB |
+13.635 bits |
+93.72 dB |
-72.58 dB |
| 44100 |
+85.18 dB |
-85.49 dB |
+82.32 dB |
+13.381 bits |
+92.51 dB |
-85.78 dB |
| 48000 |
+84.06 dB |
-85.99 dB |
+81.91 dB |
+13.312 bits |
+93.81 dB |
-90.55 dB |
| 48000 / 1024 |
+46.13 dB |
-inf.00 dB |
+46.13 dB |
+7.369 bits |
+50.72 dB |
-91.34 dB |
The SNR, THD, SINAD, and ENOB all improve as the sample rate decreases.
What is unusual is that crosstalk gets worse as the sample rate
decreases. Crosstalk goes from -90 dB at 48000 to -20 dB at 4000 which is
too much to be explained as an increase in cross channel leakage. With
other sound cards, the crosstalk actually improves as the sample rate
decreases. Something strange like a rogue
AGC is operating inside the
iMic v0.06 circuitry.
Fedora core3 and Ubuntu 5.04 had similar distortion measurements.
deep zoom
So far the spectral performance of the iMic v0.06 looks very good.
The loop error instability in the Sample Rate
section suggests that something strange is at work like an extreme amount of
jitter. This section will explore this anomaly with a concept know as
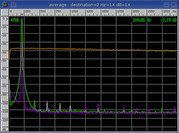
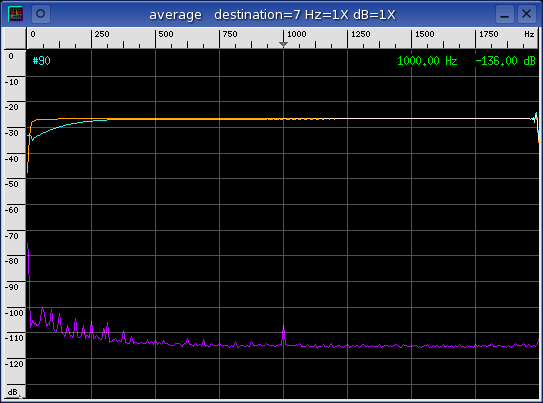
deep spectral zoom.
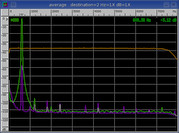
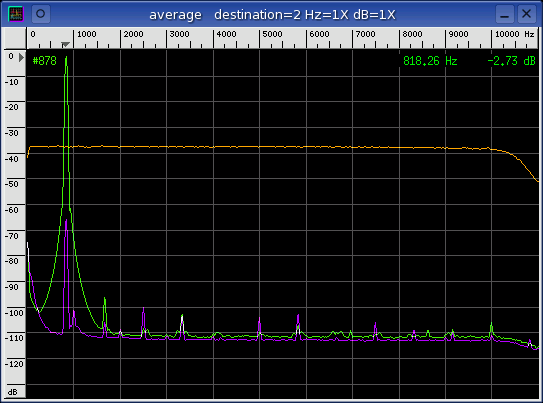
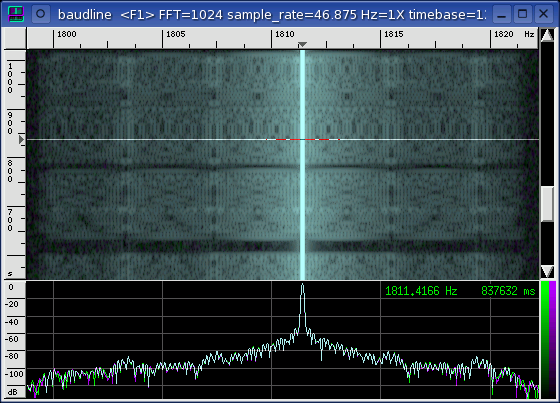
The down mixer feature in
the Input Devices window is used to perform a deep zoom into the frequency
domain. This DDC
increases the frequency resolution and allows the observation of finely spaced
spectral details. The sample rate is 48000 with a 1024 decimation ratio
for an effective 46.875 sample rate. The 1024 decimation factor translates
to the frequency resolution of an equivalent 1M point FFT. Below
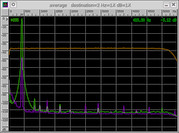
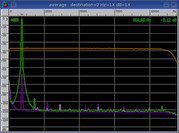
are the standard sine wave, WGN, and crosstalk spectrum plots. The
spectrogram has a couple wideband glitches that are the same errors as seen in
the Sample Rate section.
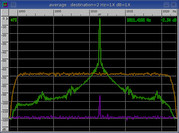
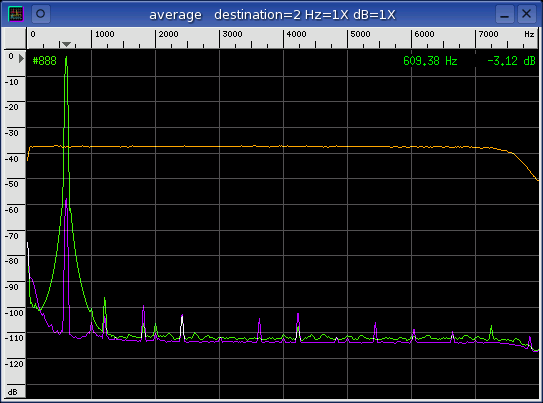
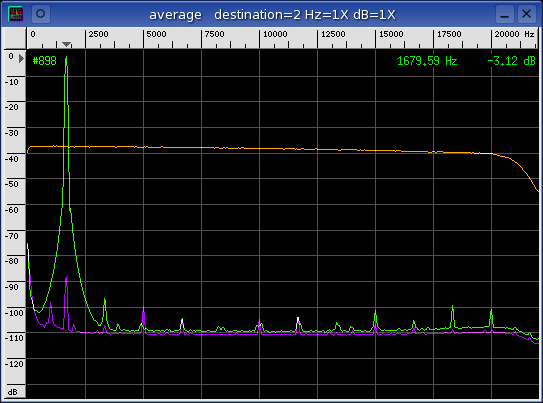
|
48000 / 512
|
|
|
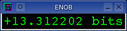
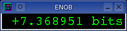
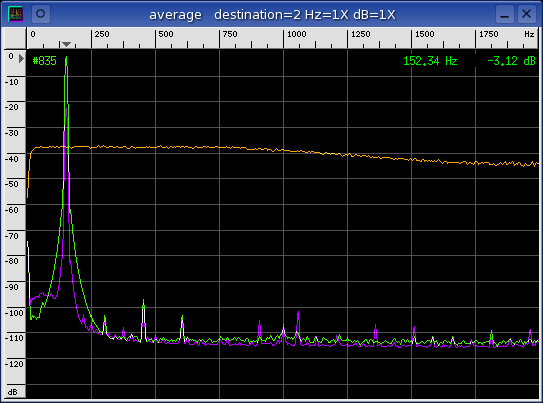
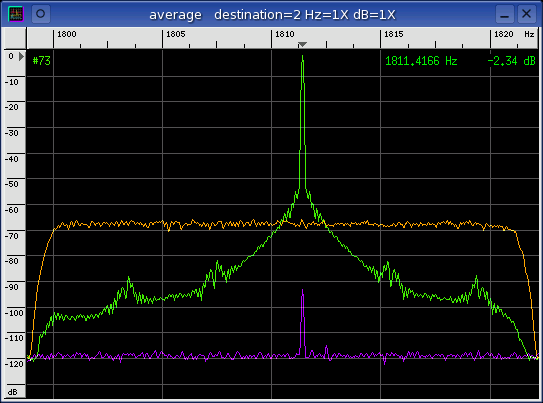
Some very major distortion is creating a number of modulation spurs that lower
the ENOB down to +7.369 bits. The spurs are very dynamic, have a spacing
of 4 Hz, and decrease the ENOB by 6 bits. The distortion in the
spectrogram display generates some unique patterns. With other
sound cards, such a deep zooming usually increases the ENOB by more than 1 bit
and results in a clean spectrum. The mystery remains hidden but something
periodic and bad is definitely lurking inside the iMic's DSP logic.
|
|
|
|
Quantization |
A white Gaussian noise signal source was generated and captured in full
duplex loopback fashion at each of the standard sample rates. The
Histogram plots below
show a unique sample distribution that is dependent on sample rate.
5510, 11025, 12000, 22050
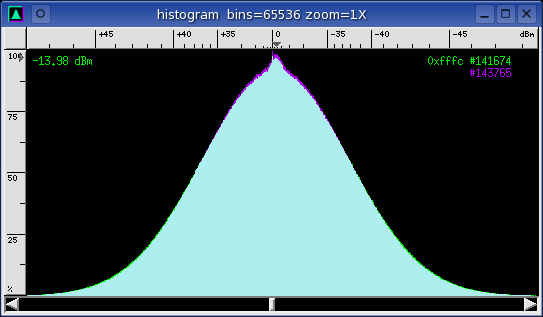
The point at the center line is caused by fragment slips that insert long
sequences of zeros into the data stream.
4000 ... 48000
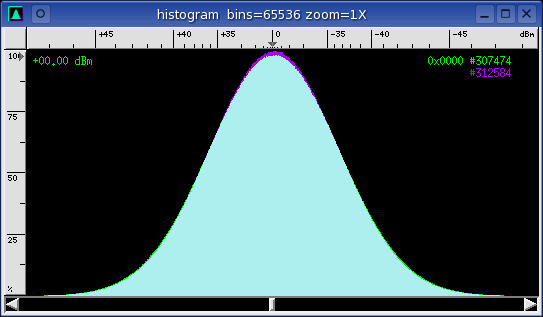
All sample rates except 5510, 11025, 12000 and 22050 have nice clean Gaussian
shaped histogram curves.
|
|
|
|
Channel Delay |
A sine wave signal was generated and captured in full duplex loopback
mode. The time domain response was observed with the
Waveform window where
the green curve represents the left channel and the purple curve represents
the right channel.
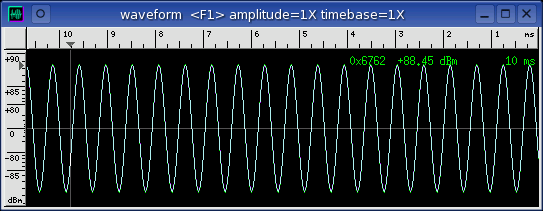
The iMic v0.06 has a zero sample inter channel delay at all sample rates.
|
|
|
|
Analysis |
The wild variance and the erratic behavior of the loop error sample rate
measurement prompted the deep spectral zoom investigation which found some very
unusual modulation spurs. These modulation spurs add noise to signals at
all sample rates. They have a 4 Hz spacing, contaminate all signals, and
reduce the ENOB measurement by 5 bits. The source is likely an AGC or an
internal filter problem.
Wideband spectral glitching was observed at all sample rates but the lower
rates suffer the greatest from the affliction. The 5510, 11025, and 12000
sample are excessively problematic. The spectral glitches match the
discontinuities seen in the sample rate estimates and the DC peak in the
quantization histograms. The spectral glitches are the result of the
erroneous insertion of zeros and are likely caused by a USB or a driver
problem.
The ADC / DAC filters are very sharp and well defined above the 5510 sample
rate. The ADC filter at the 4000 and 5510 sample rates is nonexistent
but this doesn't significantly hurt the distortion measurements.
Fedora core3 had larger sample rate errors more spectral glitching that
Ubuntu 5.04 had. Distortion measurements between the two Linux
distributions were almost identical.
|
|
|
|
Conclusion |
The iMic v0.06 has very sharp ADC / DAC filters, clean spectrogram sine sweeps,
and extremely good distortion measurements. Unfortunately it has a
number of serious flaws hidden under the surface that required inquisitive and
rigorous testing to find. The wideband spectral glitches and the
modulated spurs reduce the iMic's performance rating from Excellent to
Poor.
The choice of Linux distribution plays an important role in quality and
performance. In the case of the iMic v0.06, Ubuntu 5.04 was superior to
Fedora core3.
If you must use an iMic v0.06 then use the 32000, 44100, or the 48000 sample
rates. The lower rates just have too many problems.
|
|
|
|
|


