|
|
|
Abstract |
Swept sine vs. white Gaussian noise
E. Olson, May 6 2005
Develop a method for measuring the frequency response of an unknown propagation
channel. Compare the benefits and drawbacks of using a linear sine wave
sweep versus white Gaussian noise
(WGN) as the stimulus
signal. The goal is to create a fast and accurate
procedure for determining the filter response of a full duplex black box
DUT.
|
|
|
|
Introduction |
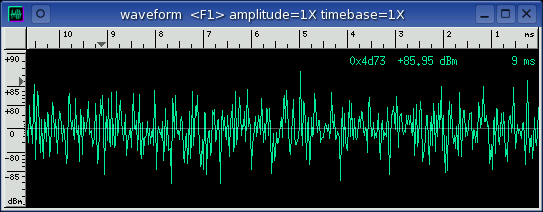
Use the baudline signal analyzer to generate the sweep and WGN sources,
capture the input signal, and calculate the average spectra. The
following describes the theory and procedure needed to characterize the
frequency response of a propagation channel.
black box
Treat the Device Under Test (DUT) as an unknown black box. The only way
that information about the propagation channel can be extracted is by probing
with an input stimulus and then measuring the output characterization
signal. Standard black box testing consists of these three elements:
The propagation channel can add various forms of noise and distortion to the
input signal and this change in signal characteristics defines the black box
filter function. The primary focus of this application note is how to
determine the frequency response of the black box filter function.
|
|
|
|
test signal source |
 Baudline's
Tone Generator
is a versatile signal source that can create the appropriate stimulus functions
needed for this study. The output functions are highly configurable and
a digital loopback mode is even possible for quick experimental testing.
Both white Gaussian noise and a swept linear sine wave will be
investigated.
Baudline's
Tone Generator
is a versatile signal source that can create the appropriate stimulus functions
needed for this study. The output functions are highly configurable and
a digital loopback mode is even possible for quick experimental testing.
Both white Gaussian noise and a swept linear sine wave will be
investigated.
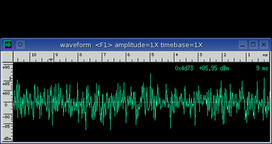
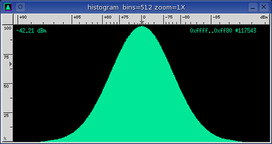
white Gaussian noise
WGN is constant spectral energy at all frequencies with a probability histogram
that follows a Gaussian bell shaped curve (see above right). It is truly
random noise with a flat frequency spectrum and that makes WGN an excellent
excitation test signal.
Due to WGN's random nature, the calculated spectrum slices will have a large
variance. If high resolution plots are desired then longer Average
collection times will be necessary.
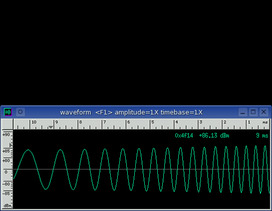
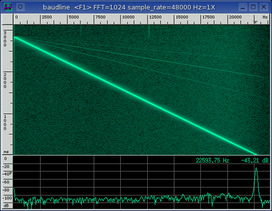
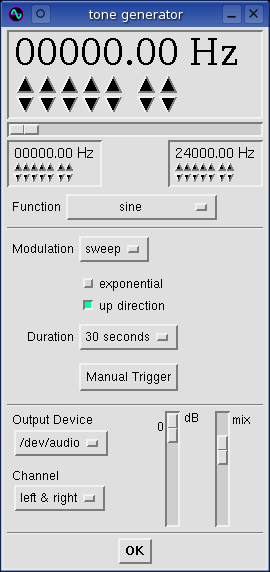
swept sine
The linear sine sweeps that are of interest here will start at 0 Hz
(DC) and end at the
Nyquist frequency. The
full spectrum width is swept and this creates a constant spectral energy at all
frequencies (just like WGN). The duration parameter is important.
Too short of a duration creates a sweeping lobe that is too wide for any fine
detail in the frequency domain. The selection of the spectrogram ON and
OFF times are also important for absolute energy measurements. These
issues make using the swept sine stimulus signal slightly more complicated
than WGN. So careful experimental technique is required.
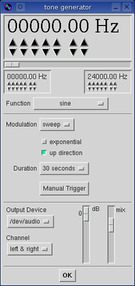 The tone generator settings for a 48000 sample rate:
- start frequency: 0 Hz
- end frequency: 48000 Hz
- function: sine
- modulation: sweep
- shape: linear
- direction: up
- duration: 30 seconds
- channel: left & right
- gain: 0 dB
|
|
|
|
black box setup |
 The black box can be an external piece of sophisticated hardware or it can
be a simple cable. It can even be a virtual concept such as the digital
loopback mode. The setup may be different and vary greatly but the
testing methods remain the same.
The black box can be an external piece of sophisticated hardware or it can
be a simple cable. It can even be a virtual concept such as the digital
loopback mode. The setup may be different and vary greatly but the
testing methods remain the same.
loopback wiring
We want to measure the performance of our test equipment. The quality of
the ADC and the
DAC play a very important role
in test and measurement. They act as hard limits to the upper bounds of
performance. So our first goal is to measure these limits and then use
them to create a baseline standard to work from. An added bonus is
doing this with a minimal amount of equipment by using a loopback mode.
We are going to make the black box test itself by making the black box the
cable. Or as is depicted in the picture above, the black box now
becomes baudline!
With baudline there are four possible loopback modes:
- external cable
- internal "volume" mixer channel
- digital tone generator loopback option
- half duplex operation for special cases
The first three are proper full duplex modes where the sound card's input
is connected to it's output. For half duplex an external function
generator is required (this could be a second sound card running
baudline). The half duplex mode is important for three reasons:
- some older sound cards only operate at half duplex
- sometimes the full duplex performance differs from the half duplex
performance.
- the same card can be run at two different sample rates for "Nyquist
folding."
 gain settings
Set the gains so that the test signal is strong enough to be far above the
noise floor. The test signal should also be a bit below the clipping
point so that the distortion measurements are good for all of the sweep
frequencies. A high output gain and a low input gain are good starting
points for finding the optimal gain settings. Having optimal gain is not as
critical for this test experiment as it is for other tests but a strong signal
with reduce the effects of the noise floor. So a strong signal that
avoids excessive distortion should be the goal. Using the
THD and
SINAD distortion measurement
windows are useful tools in finding a good working gain value.
Measuring frequency response at multiple gain levels can be insightful for
discovering many different types of non-linear filter behavior.
Also using a completely attenuated test signal (zero) is a good way of
measuring the frequency response of the noise floor.
|
|
|
|
signal analysis |
 This section compares the frequency response qualities of a swept sine wave
versus white Gaussian noise (WGN). Baudline's Tone Generator is used
as the signal source and the spectrum are collected with the
Average window.
For a fair comparison both the swept sine duration time and the WGN collection
time are set for 30 seconds.
This section compares the frequency response qualities of a swept sine wave
versus white Gaussian noise (WGN). Baudline's Tone Generator is used
as the signal source and the spectrum are collected with the
Average window.
For a fair comparison both the swept sine duration time and the WGN collection
time are set for 30 seconds.
The audio card for the following test is the Creative Sound Blaster 128 (also
known as the SB128 and PCI16 ENS1371).
swept sine and WGN
For this test the input and the output sample rates were both set to
48000 and a single instance of baudline was running in full duplex mode.
The WGN test source was collected for 30 seconds in the Average window as the
red plot. WGN is a random signal and the jaggedness is a function of the
variance which is fairly large. A longer collection time would result in
a smoother plot.
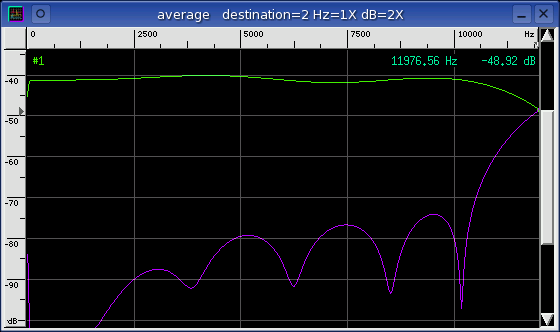
Pressing the Manual Trigger button started a 30 second duration linear sweep
from 0 Hz to 24000 Hz (the Nyquist frequency) after which baudline was
paused. The start and end sections of the sweep were carefully selected
in the spectrogram and then pasted into the Average window.
Legend:
- red - WGN
- green - sine sweep
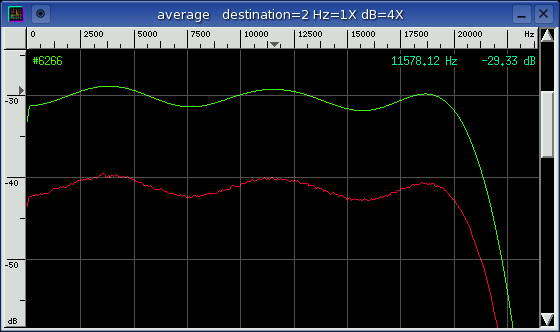
Other than the 11 dB offset, the swept sine and the WGN curves look very
similar. To correct for the dB offset the above swept sine test was rerun
with a -11 dB digital gain setting in Tone Generator window. The dB
axis was zoomed in 32X to get a better look. Below is the result.

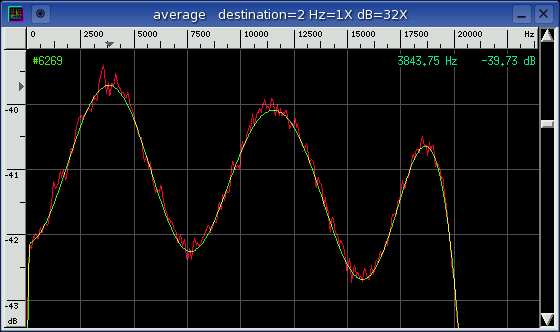
The above zoomed in plot makes the 3 dB of passband filter ripple easy
to measure an it makes it easy to compare the two different test
functions. The swept sine and WGN curves match perfectly except for
variance errors due to WGN's short collection time. WGN needs to be
collected for about 8 minutes (a 16X increase) before it starts to approach
the smoothness of the swept sine. Note that variance is proportional
to the square root of time.
The gain difference between the swept sine and WGN brings up another very
important point. Frequency resolution gain is a function of sample rate,
decimation, and/or FFT size. This phenomena is described with more
rigor in the
Sine Distortion Measurement
application note. What this means is that as the bin resolution increases
the difference between the swept sine and WGN gain also increases. This
can cause problems because WGN gets pushed down towards the noise floor and the
closer the signal is to the noise floor the larger the noise floor's impact can
be.
calibration
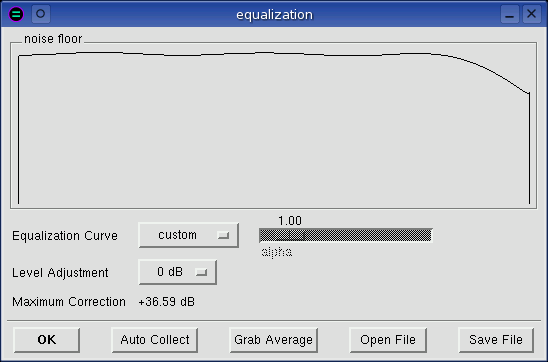
The system frequency response can be calibrated with baudline's
Equalization
window. This equalization produces a flat spectrum and it removes
any frequency response errors due to the ADC. Both WGN and the swept sine
average spectral responses can be used as a correction source by pressing the
Grab Average button. The Auto Collect button can also be used for
calibration in the Record and the Pause modes.
Nyquist folding
The goal of this section is to build a complete picture of the audio card's
anti-alias low pass filter
(LPF). The previous
experiment measured only the in-band Nyquist response and the objective here is
to measure the out-of-band response. Usually this information is only
available to the hardware designer but with a little clever use of aliasing
the stop-band filter response can be extracted.
The Nyquist sampling theorem determines the highest frequency that can be
represented by a particular sampling rate. Signals that are beyond the
Nyquist frequency limit either get attenuated by the ADC or DAC's LPF and/or
they get aliased. This
aliasing is called the
"fold back."
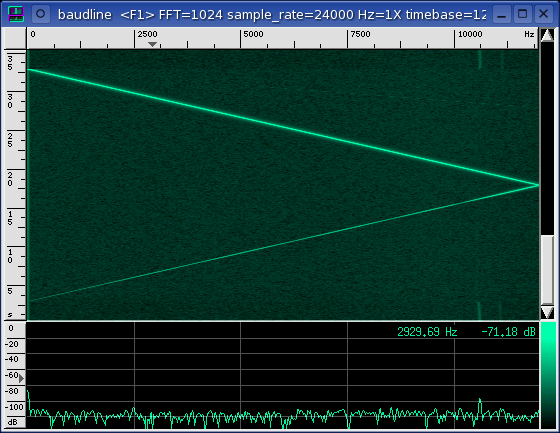
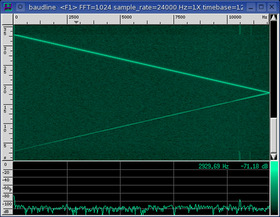 See the spectrogram image on the right. Two instances of baudline were
run; the Tone Generator source at a 48000 sample rate, and the collection sink
at a 24000 sample rate. A zero Hz to 24000 Hz sine wave sweep was the
source test signal.
See the spectrogram image on the right. Two instances of baudline were
run; the Tone Generator source at a 48000 sample rate, and the collection sink
at a 24000 sample rate. A zero Hz to 24000 Hz sine wave sweep was the
source test signal.
The two lines of the swept "V" shape were selected individually and then pasted
into the Average window. The 0 Hz to Nyquist samples make up the green
spectrum. The folded back Nyquist to 0 Hz samples make up the purple
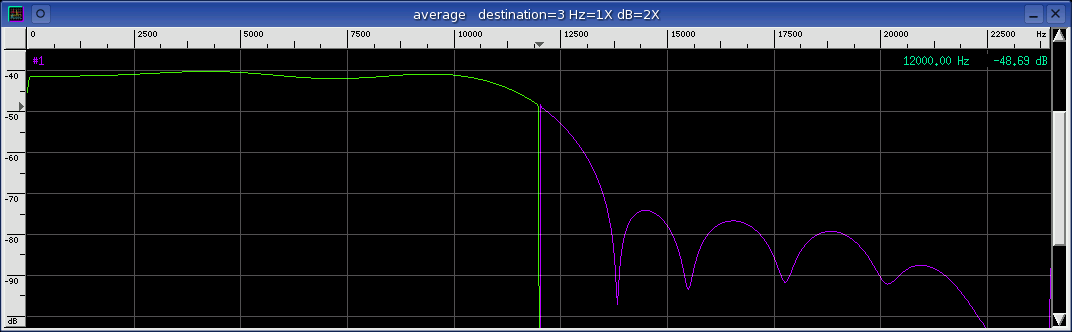
spectrum. Below is the Average window which shows this:
Legend:
- green - sine sweep
- purple - sine sweep folded
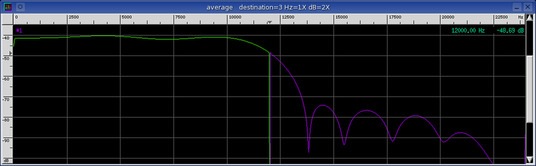
The purple curve in the above plot was flipped around the Nyquist point to
show the full LPF response. This was accomplished with a short program
that operated on the saved Average window's ASCII text file. The filter
stopband attenuation for the SB128 measures to be about -34 dB which not that
great for a computer sound card.
|
|
|
|
Conclusion |
Both the swept sine and WGN test signals generated good frequency response
measurements. Now let's compare the benefits of each test method.
swept sine:
- faster
- less variance
- better resolution
- stronger so noise floor has less of an effect
- can do Nyquist folding or out-of-band response
- trickier to do correctly, thus more prone to error
WGN:
- simple to do, just turn it on and accumulate
- doesn't excite resonant modes like a sine wave
- wideband spectral source less likely to cause non-linear effects
The best signal source to use depends a lot on your specific
requirements. Actually the best answer is to use both. Baudline
makes it easy to test with both swept sine and WGN sources. Comparing
the differences between the two methods could yield useful insights that
otherwise might of remained unknown.
|
|
|
|
|