RBH transducer measurements 10/21/97
The setup
The set up was 4 RBH transducers sandwiched between the couch and the floor
powered by a 150W amp with the crossover set at 80Hz. A function generator
was the signal source and was set to: .5 Vpp sine wave output. The noise
floor of the room was around 50 dB SPL C. A fan was blowing on the amp
inorder to keep it cool and linear.
My newest Radio Shack 33-2050 sound level meters (the one with the word Radio
Shack on it) was used. It was placed on the center cushion right where a
persons butt would typically be. Because of its coupling to the leather
couch its measurements are a combination of air vibration and mechanical
couch vibration.
EQ table
| curve |
25Hz |
31Hz |
40Hz |
50Hz |
62Hz |
80Hz |
| flat |
0 |
0 |
0 |
0 |
0 |
0 |
| EQ1 |
+6 |
+6 |
-12 |
-12 |
+4 |
0 |
| EQ2 |
+12 |
+12 |
-12 |
-12 |
+12 |
+12 |
| EQ1+2 |
+18 |
+18 |
-24 |
-24 |
+16 |
+12 |
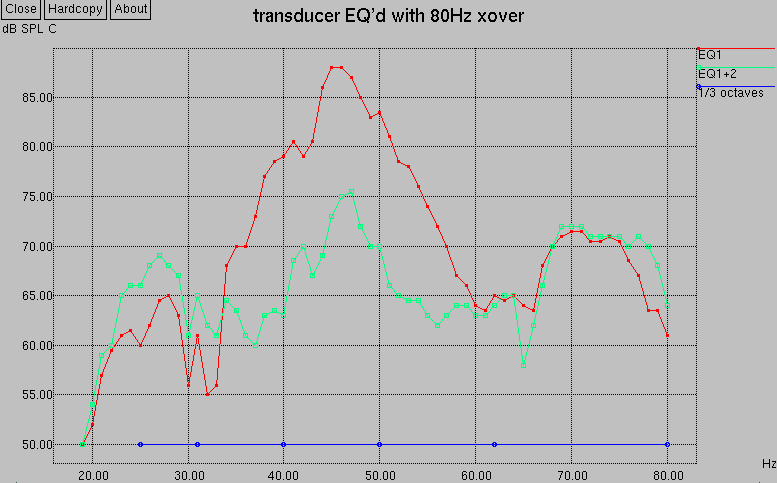
Plots comparing different EQ curves. EQ1 vs. EQ1+2 which is the sum of both
EQ1 and EQ2 turned on. For both measurements only the weight of one person
(167 lbs) was on the couch. Notice that the green EQ1+2 curve is
flat 21Hz - 80Hz +/-8dB, but this flatness eats a lot of useable power.

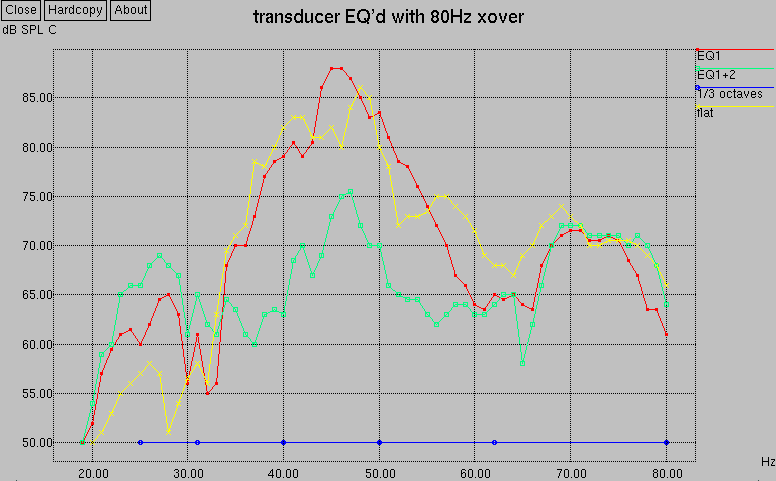
Plots comparing the above two EQ plots plus a flat plot with the crossover
set at 80Hz from the 10/17/97 experiments. Notice that the flat curve and
the EQ1 are similar. I believe this is due to differences in the setup.

Check out my quest for bass page.


